Proto Viewer Developer Guide
This project allows visualization of messages transferred in protobuf format. This is a passive component that shows the messages explicitly delivered to it; it does not listen (“sniff”) all network traffic searching for protobuf data. Displaying the contents of a protobuf message requires the corresponding protocol buffer definition (.proto) file, which are fetched from a network server, usually a Nexus registry.
Dependencies
If you are running in Docker there are no external dependencies, for better or worse[1] it is totally self contained.
If you are running locally, please follow the quickstart guide below.
[1] This Docker container runs Redis and Bokeh. The original requirements stated that the probe had to be a single Docker container.
Design
The proto-viewer enables viewing of binary-encoded protocol buffer messages passed among elements of a composite solution by the runtime orchestrator component. To display message content the proto-viewer must parse the binary message using a protocol buffer message definition file. Those files are obtained dynamically by the proto-viewer from network sources.
Messages are passed to the proto-viewer by the Acumos blueprint orchestrator component, also known as the model connector. The model connector makes HTTP POST calls to deliver a copy of each message to the proto-viewer along with some details about the message definition.
Each message POST-ed to the proto-viewer must contain only binary Protocol-Buffer encoded content, and must include the following HTTP headers:
PROTO-URL
Message-Name
The “PROTO-URL” parameter can be either a complete URL (e.g., “http://host:port/path/to/file”) or just a suffix (e.g., “/path/to/file”). The URL is used to fetch the protocol buffer specification file for the message. The “Message-Name” parameter specifies the name of the message (data structure) within that protocol buffer specification file, which may define multiple messages.
If the PROTO-URL header parameter is just a suffix, the value of this environment variable is consulted:
NEXUSENDPOINTURL
This is expected to contain the prefix of a URL where the protocol buffer file can be obtained; e.g., “http://host:port/context/path”.
When the probe is sent the URL of a protocol buffer definition file, the probe downloads the .proto file. The file is also cached for reuse if the same URL is encountered again. One complication here is that the protoc tool fails for input files that contain a dot or hyphen in the filename, so the filenames are mangled by the proto-viewer to remove all offending characters. A second complication is that the proto file is only downloaded once and changes will not be discovered; but this should never happen without the version number changing.
The probe then invokes the “protoc” compiler on the definition file to generate a Python module, working in a temporary directory. Finally the proto-viewer imports the newly created Python module and uses it to parse binary messages.
The probe normally listens for requests on port 5006, which unfortunately cannot be changed due to flaws in the Bokeh library. The probe also limits connections using a websocket filter. To allow deployment in a Kubernetes environment where port 5006 is not readily accessible, the probe can be configured to accept incoming requests on any port by setting the environment variable ACUMOS_PROBE_EXTERNAL_PORT.
Data Stores and Retention
The proto-viewer stores incoming data feeds (one feed per model and message) so that it can produce visualizations such as time series.
The feed content is maintained in two data stores. The first store is Redis, which holds every raw incoming message, subject to retention as discussed below. The second store is a Bokeh data structure known as a “Column Data Store”, which holds the message data selected by a user in a Bokeh session. Bokeh expects to serve its data from its column data store. However, that store has some constraints on it; for example it is JSON, so it does not support “bytes”, which are what images are. So when message data is fetched from the Redis store for use by Bokeh, a conversion is performed to produce the format that Bokeh expects.
The current server-side data retention policy in Redis is that the raw data cache resets every midnight. Meaning, if a user logs into the proto-viewer, they will see all data that came in since the prior midnight, and will see new data as it streams in. This is because the proto-viewer may be a long running process, and memory would increase without bound, so there has to be a TTL on data. If there is a need for a user to log in and see MORE data than the prior midnight, we can change this later by increasing the TTL to the last week or something.
For the client side, Bokeh uses column data source(s) for each session. A column data source holds the data sent from the server to the browser, so we also have to limit the client side data in case a user is logged in for a very long time. The “streaming limit” for numerical data is 100,000 records, just over a day of data assuming one record per second. The streaming limit for images and raw data is just 1; the user sees it as it goes by, or it is lost (there is currently no replay).
I thought the Bokeh stores can have their own timeouts, and for the image one, the code set it to 1. This can be seen as ” stream_limit” in the bokeh run file. However now that I’m looking at Bokeh’s documentation, I don’t actually see that parameter in their source code! So I’m not sure it works. It might just control how many items go into it at any given time.
The function that uploads data from Redis to Bokeh (which is doing the copying), depending on what the user is trying to look at, is a Bokeh callback implemented in the run.py script.
To reduce Redis memory usage consider the following options:
- Reduce the historic time window of data; i.e., drop all data much sooner.
- Send fewer feeds. If you want a more “microservice-ey” architecture, you could launch more probes, send them each a fraction of the feeds, and each will use less total data
- Send the same number of feeds but at a reduced rate
- Send smaller data in each feed. If you are sending the probe images, and each one is a few hundred KB or MB, that is going to pile up quickly.
Filesystem
This application makes the directory /tmp/protofiles and uses that for the proto files. Inside Docker this all gets cleaned up. On your machine if you run this, be sure to clean that after. Note many OSs automatically clean up /tmp on reboot.
Build
Follow these instructions to build the Docker image with all required software. Please replace “my.registry.com:12345” with a host name and port combination where a Docker registry server listens.
docker build -t my.registry.com:12345/acumos_proto_viewer:X.Y.Z .
docker push     my.registry.com:12345/acumos_proto_viewer:X.Y.Z
Run
Follow these instructions to launch the Docker image with the proto-viewer.
docker run -dt -p 5006:5006 -e NEXUSENDPOINTURL=xxxx my.registry.com:12345/acumos_proto_viewer:X.Y.Z
Required environment variables
The following required environment variables determine the proto-viewer behavior:
- ACUMOS_PROBE_EXTERNAL_PORT (optional, defaults to 5006)
- NEXUSENDPOINTURL (required, no useful default, must be URL of server with protobuf files)
Optional additional environment variables
The following optional environment variables alter the proto-viewer behavior:
- UPDATE_CALLBACK_FREQUENCY This sets the frequency (milliseconds, 1000=every second) of the callbacks that update the graphs on the screen, e.g., 500.
Extra Fields
Every protobuf message that enters the /senddata endpoint is injected, by this server, with additional keys:
- apv_received_at: the epoch timestamp when the model was received. Can be used for plotting a single variable against time
- apv_model_as_string: the string representation of the entire model, used for plotting the raw message content and structure
- apv_sequence_number: the sequence number of this “type” of raw data, where type = (model_id, message_name)
Development Quickstart
The following steps set up a machine as a development and test environment without use of Docker, which is convenient for use on a typical desktop/laptop.
Install prerequisites so they can be invoked by the probe:
- Python version 3.6+, ideally in a virtual environment
- The protocol buffer compiler (“protoc”), version 3.5.1 (note: 3.6.1 does not appear to work, requires investigation)
- The npm tool, version 2.15.5 or later
- The npm package protobuf-jsonschema, version 1.1.1 or later (npm install protobuf-jsonschema)
Clone the proto-viewer repository (which you may already have done, since you’re reading this):
git clone https://gerrit.acumos.org/r/proto-viewer
Download the Redis server source from this site:
https://redis.io/download
Build the Redis binary, which requires a C compiler and the make tool:
makeStart the Redis server on the development machine:
src/redis-server
Create a virtual environment with Python 3.6 or later. The name “apv36” is not magic, but will be used in all of the following directions:
virtualenv -p python3.6 apv36
Activate the virtualenv:
source bin/activate
Use the newly created virtual environment to install the proto-viewer (i.e., this) python package:
pip install -r requirements.txt
pip install .
Start a Python HTTP server to publish the protocol buffer definition files. It uses port 8000 by default:
cd tests/fixtures; python -m http.server
Set an environment variable with the appropriate URL of the Python HTTP server:
export NEXUSENDPOINTURL=http://localhost:8000
Launch the Bokeh-enabled web server that is the proto-viewer:
./bin/run.py
Start the data-injection script:
./bin/fake_data.py
Open a web browser:
http://localhost:5006
Never ever change the port. It will not work. It will evolve to endless suffering. Darkness will envelop you. Essentially there’s a bug in Bokeh.
Testing
The proto-viewer can be tested standalone; i.e., without deploying a composite solution to any cloud environment. Follow the development quickstart instructions above to install prerequisites and start the necessary servers. Then use the data-generation script described next.
Data Injector
A Python script is provided to generate and send data to the probe. The name is “fake_data.py” and it can be found in the bin subdirectory. Launch the script like this:
fake_data.py [host:port]
[host:port] is an optional cmd line argument giving the target proto to send data to; it defaults to localhost:5006 for local development.
Test Messages
The test script creates and sends messages continually. Those messages are cached within the running Redis server. The following message types are used:
- image-mood-classification-100. This message carries an array of objects including an image.
- probe-testimage-100 This message carries a single image. Use this to test display of an image.
- probe-testnested-100 This message has a hierarchical message; i.e., an inner complex object within an outer complex object. Use this to test selection of nested fields.
- probe-testxyz-100 This message carries several numeric and string values. Use this to test plotting x, y values on various graphs.
Expected Behavior
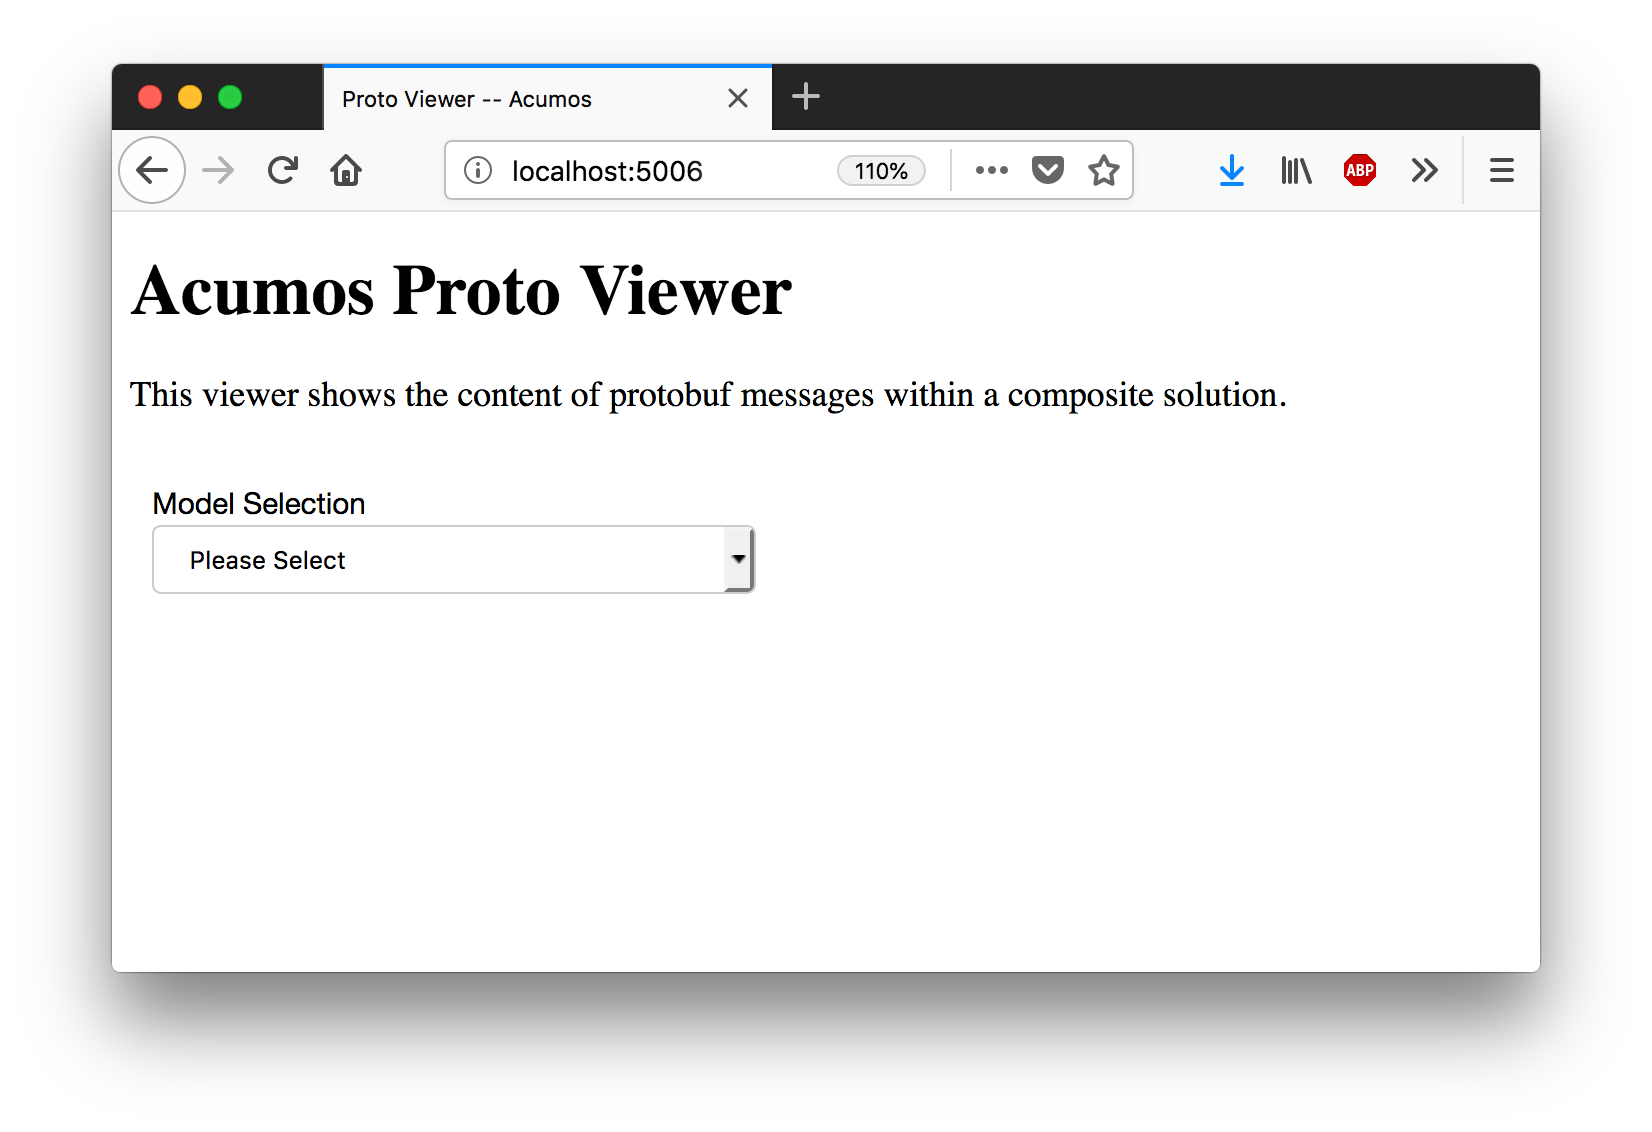
Use a web browser to visit the proto-viewer with the appropriate host and port, the default URL is the following:
http://localhost:5006
Upon browsing to this URL a page like the following should load:
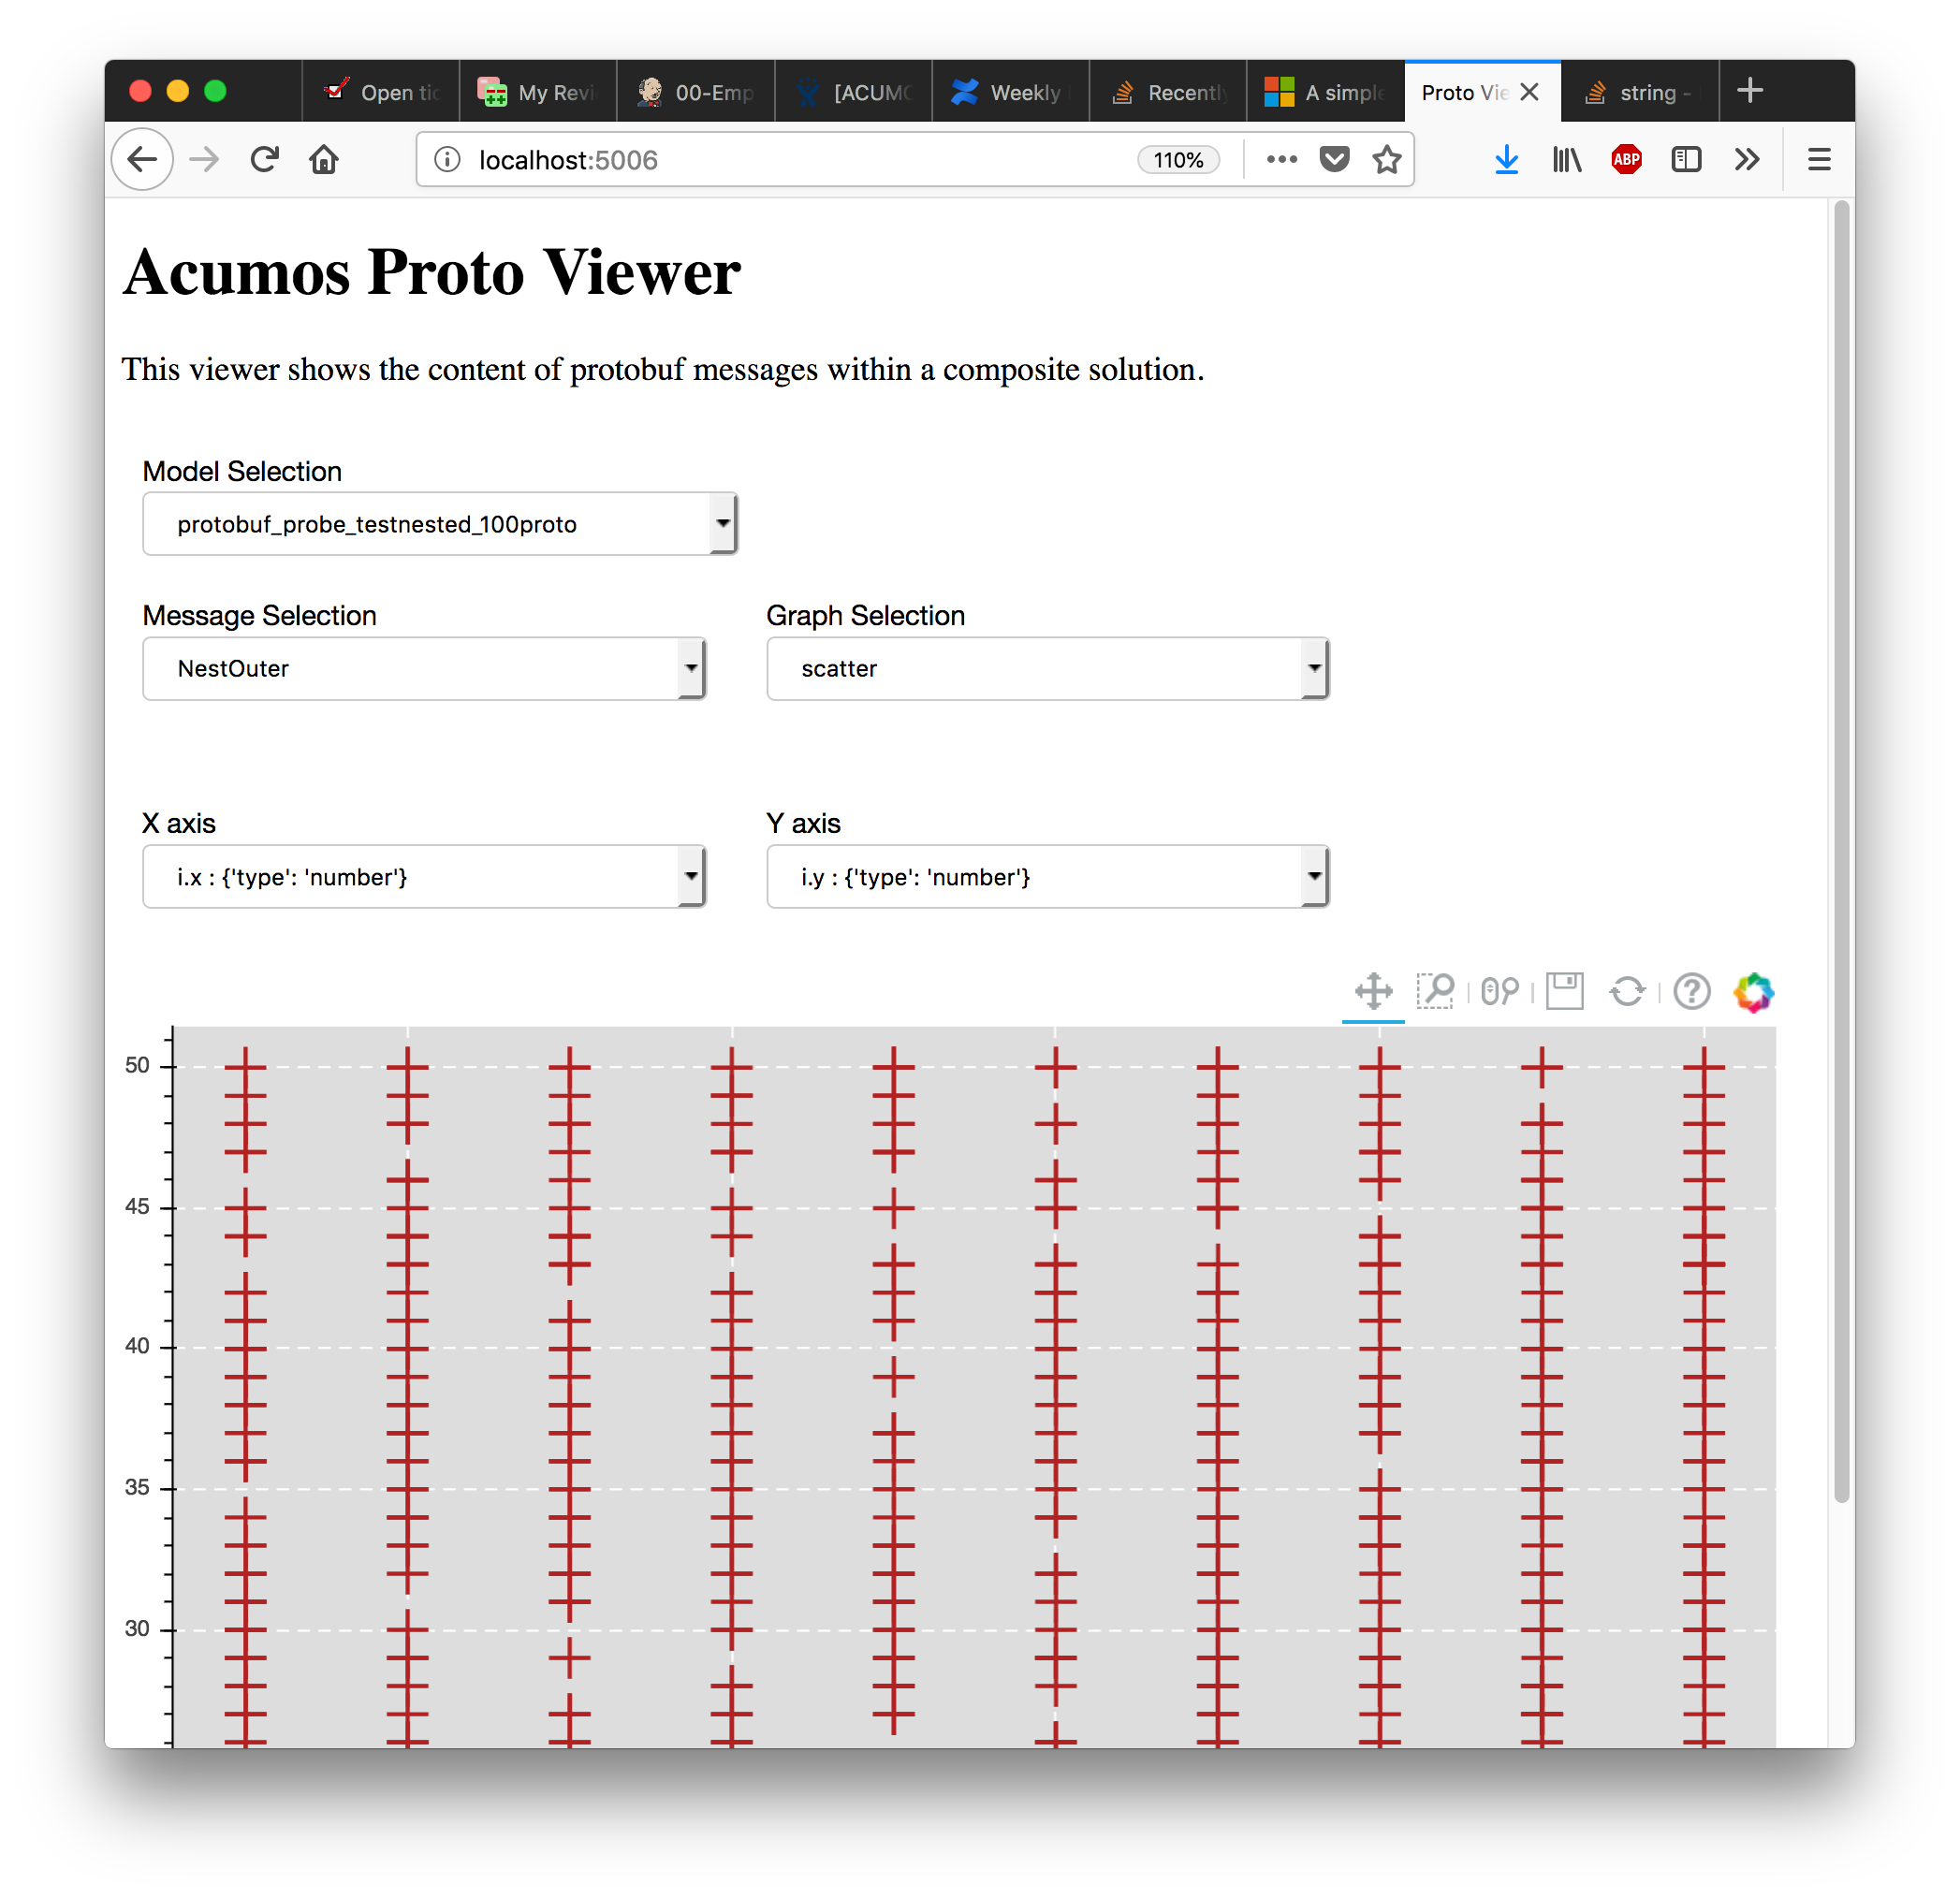
After the data-injection script has sent a few data points, follow these steps to view a plot of data that arrives in a nested message:
- In the Model Selection drop-down, pick item “protobuf_probe_testnested_100proto”
- In the Message Selection drop-down, pick item “NestOuter”
- In the Graph Selection drop-down, pick item “scatter”
- In the X axis drop-down, pick item “i.x : {‘type’: ‘number’}
- In the Y axis drop-down, pick item “i.y : {‘type’: ‘number’}
The page should change to resemble the following: