Platform Operations, Administration, and Management (OA&M) User Guide
Operations, Administration and Management/Maintenance are the processes, activities, tools, and standards involved with operating, administering, managing and maintaining any system.
Acumos Elastic Stack for Log Analytics
One of the functions of (OA&M) for the Acumos platform is to collect and correlate log files from the other platform components in order to support debugging, metrics, alarms, etc. for development and operations purposes. These metrics can reveal issues and potential risks so administrators can take corrective action. To this end, the OA&M component has defined a logging standard to be used by all of those components in order to support correlation. OA&M uses the Elasticsearch, Logstack, Kibana stack and Filebeat to collect and centralize logs that are generated via the microservices. This guide that describes how to use the Acumos Elastic Stack (formerly known as the ELK Stack).
Target Users
Acumos Platform super admins
Assumptions
All the modules are following the Acumos Logging Guidelines. As per mentioned in Acumos Log Standards Wiki
Elastic Stack Architecture
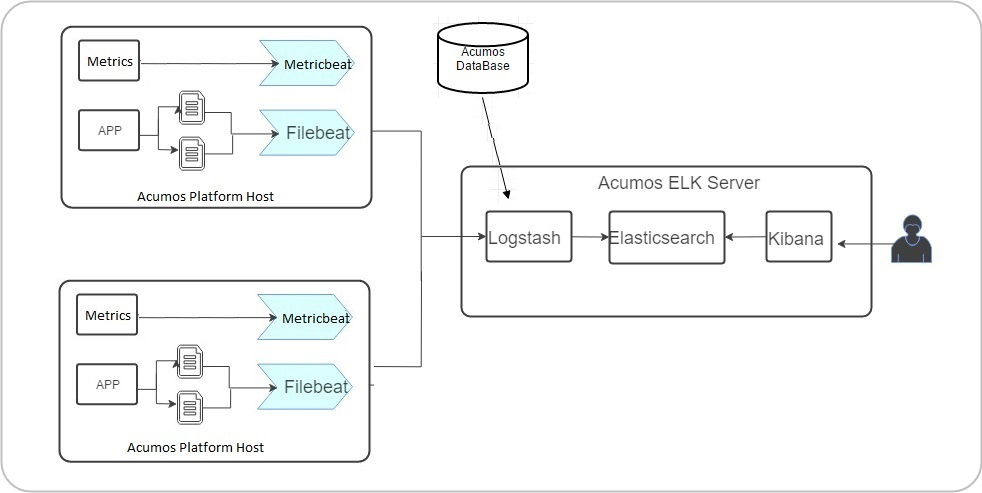
Elastic Stack Component Goal
Acumos ELK stack setup has five main components:
- Elasticsearch: Elasticsearch is a distributed open source search engine based on Apache Lucene. Acumos Elasticsearch stores all the logs and metrics of Acumos platform host.
- Logstash: Logstash is a data pipeline that helps collect, parse, and analyze a large variety of incoming logs generated across Acumos Platform.
- Kibana: Web interface for searching and visualizing logs.
- Filebeat: Filebeat serves as a log shipping agent, Installed on Acumos platform servers it sends logs to Logstash.
- Metricbeat: Installed on Acumos platform servers. it periodically collects the metrics from the Acumos platform host operating system which includes running components information and ships them to elasticsearch. These metrics are used for monitoring.
Elastic Stack Component Versions
- elasticsearch 5.5.1
- kibana:5.5.1
- logstash:5.5.1
- filebeat:6.0.1
- metricbeat:6.2.4
Elastic Stack Setup
Elastic Stack installation is automated with Docker Compose. Installation is done on a server separate from where Acumos has been installed.
Note We will install components namely Elasticsearch, Logstash and Kibana on a single server, which we will refer to as Acumos ELK stack log collector server. Beat agents namely Filebeat and Metricbeat are installed on Acumos platform host servers.
Prerequisites
Docker and Docker Compose installed
Steps
- Clone the platform-oam repository
$ git clone https://gerrit.acumos.org/r/platform-oam
- Create docker volume namely acumos-esdata and acumos-logs if no volumes created earlier.If acumos-esdata and acumos-logs volume already exist on host machine then skip this step.
$ docker volume create acumos-esdata
$ docker volume create acumos-logs
- The acumos-elk-env.sh file is the environment file for ELK stack. Update variables ELASTICSEARCH_IMAGE , LOGSTASH_IMAGE , KIBANA_IMAGE with the latest release image.
$ cd elk-stack

$ vi acumos-elk-env.sh
- The docker-compose.yml file as well as component directories are located in the elk-stack directory. Edit docker-compose.yml and make changes to these environment variables (ACUMOS_ELK_JDBC_CONNECTION_STRING, ACUMOS_ELK_JDBC_USERNAME, ACUMOS_ELK_JDBC_PASSWORD) to connect to database instance.
$ cd elk-stack

$ vi docker-compose.yml
- Starts and attaches to containers for Elasticsearch, Logstash, Kibana
$ ./docker-compose-elk.sh up -d
- To stop the running containers without removing them
$ ./docker-compose-elk.sh stop
Filebeat setup steps:
Filebeat should be installed as an agent on the servers on which Acumos is running. Add the configuration below to the docker-compose where the Acumos is installed.
filebeat:
    container_name: filebeat
    image: <filebeat-image-name>
    volumes:
      - <volume-name>:/filebeat-logs
    environment:
      - LOGSTASH_HOST=<elk-stack-host-hostname>
      - LOGSTASH_PORT=5000
Metricbeat setup steps:
Metricbeat should be installed as an agent on the servers on which Acumos is running. Add the configuration below to the docker-compose where the Acumos is installed.
metricbeat:
    image: <metricbeat-image-name>
    network_mode: host
    volumes:
    #Mount the docker, filesystem to enable Metricbeat to monitor the host rather than the Metricbeat container.
      - /proc:/hostfs/proc:ro
      - /sys/fs/cgroup:/hostfs/sys/fs/cgroup:ro
      - /:/hostfs:ro
      - /var/run:/var/run:rw
      - /var/run/docker.sock:/var/run/docker.sock
    command: metricbeat -e -strict.perms=false -system.hostfs=/hostfs
    environment:
      - SHIPPER_NAME=DOCKY
      - ELASTICSEARCH_HOST=<elk-stack-host-hostname>
      - ELASTICSEARCH_PORT=9200
      - PROCS=.*
      - PERIOD=10s
      - SHIPPER_NAME=super-app
Adding a New Log
Filebeat docker is a customized image that depends on filebeat.yml, a configuration layer. For adding new log under prospectors of filebeat.yml, need to add log location path as it is in <volume-name>.
filebeat.prospectors:
  - input_type: log
    paths:
      - /filebeat-logs/portal-be/*.log
Elastic Stack UI Tour
According to the Kibana website, Kibana is an open source analytics and visualization platform designed to work with Elasticsearch. You use Kibana to search, view, and interact with data stored in Elasticsearch indices. You can easily perform advanced data analysis and visualize your data in a variety of charts, tables, and maps. Kibana makes it easy to understand large volumes of data. Its simple, browser-based interface enables you to quickly create queries in real time.
For more details visit Kibana User Guide.
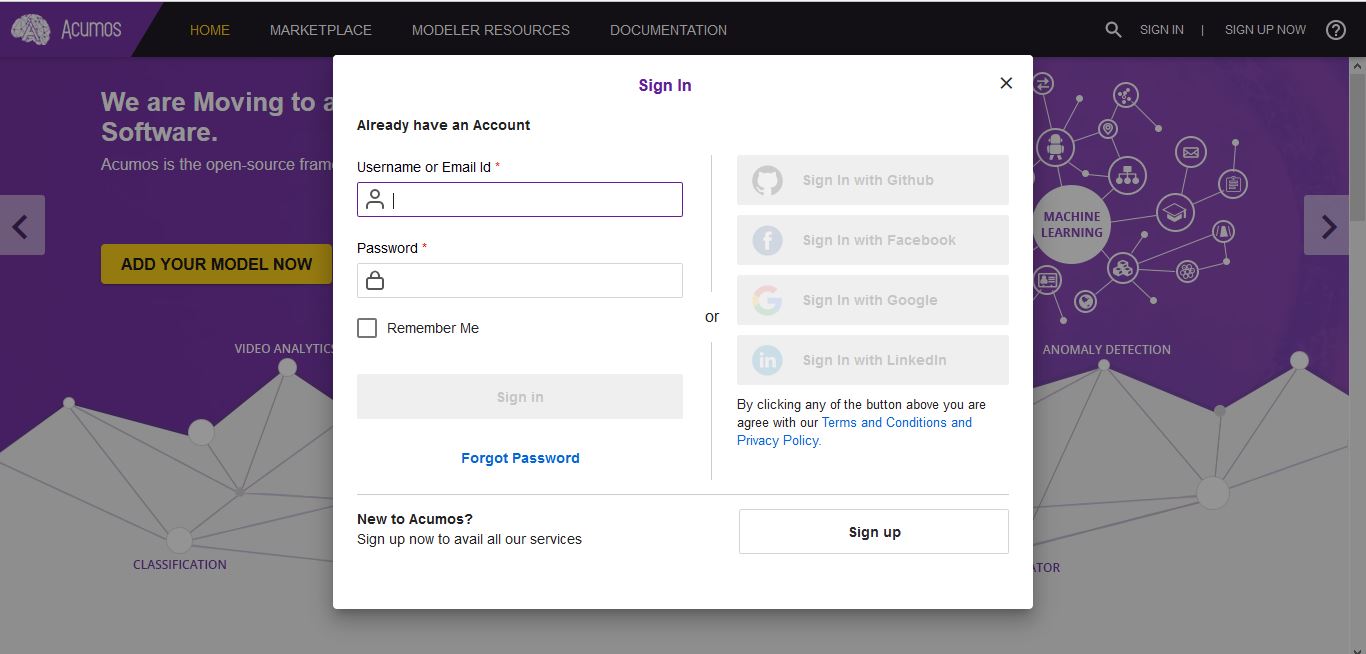
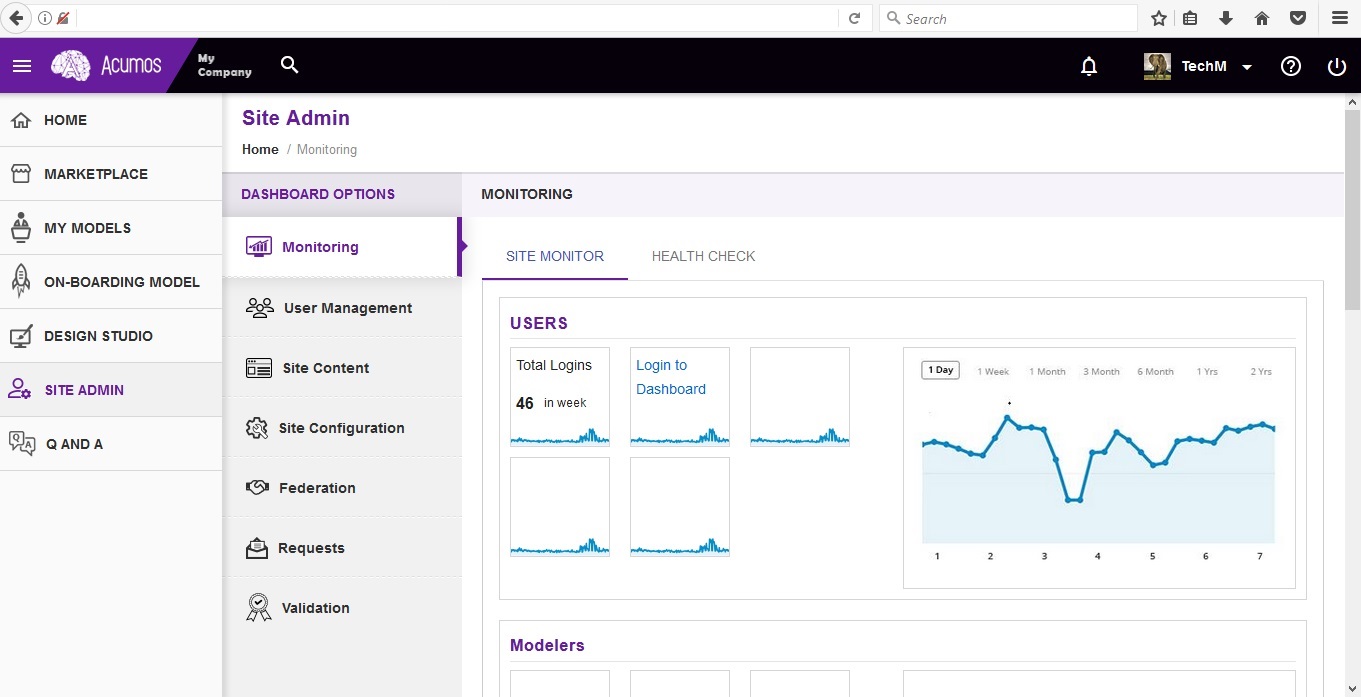
Site admins have access to Elastic Stack’s Kibana Dashboard. Login to the dashboard:
Go to SITE ADMIN -> Monitoring and click on Login to Dashboard in the USERS section
Redirects to Loading Kibana visualization platform
Acumos Kibana Dashboard Creation
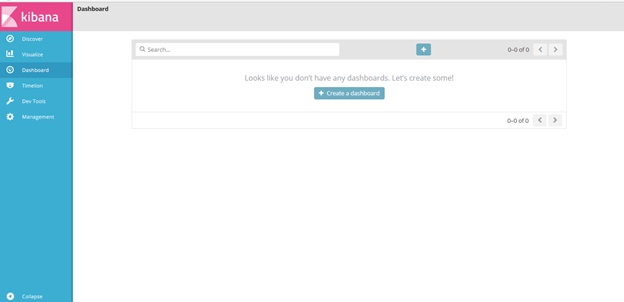
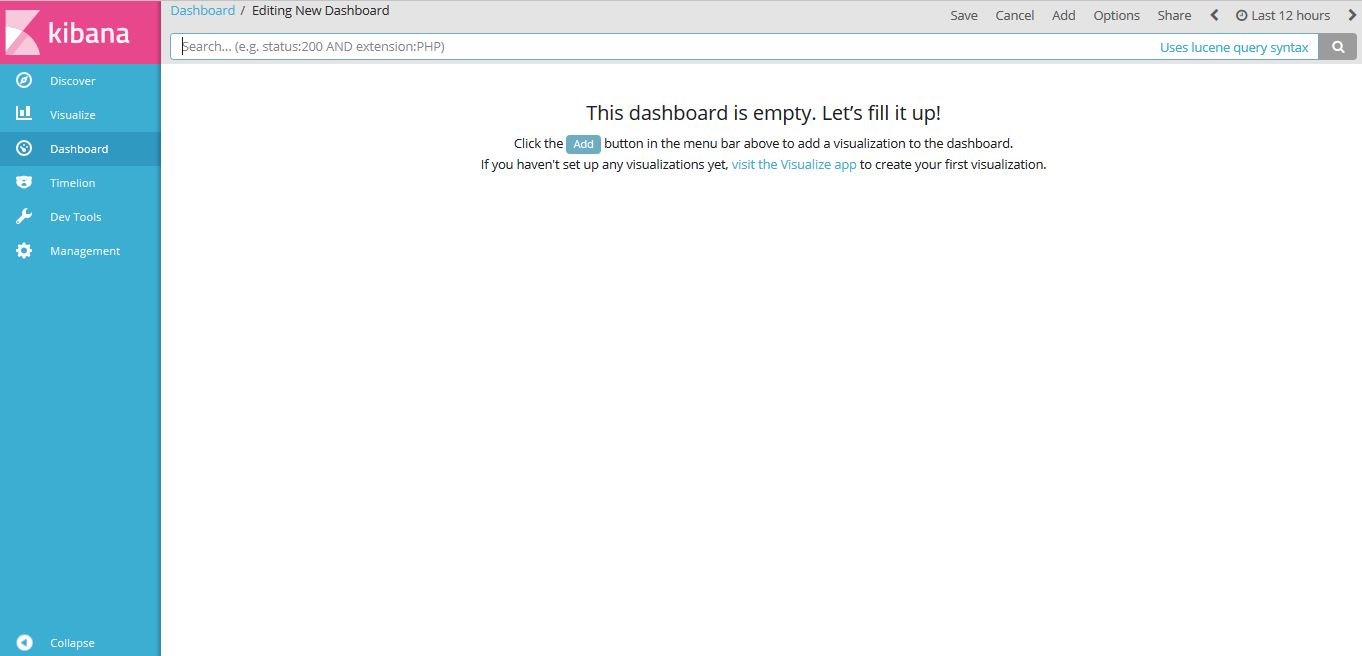
The Kibana dashboard is used to view all the saved Visualizations.
To create dashboard click on Create a dashboard or On plus sign show in the search bar.
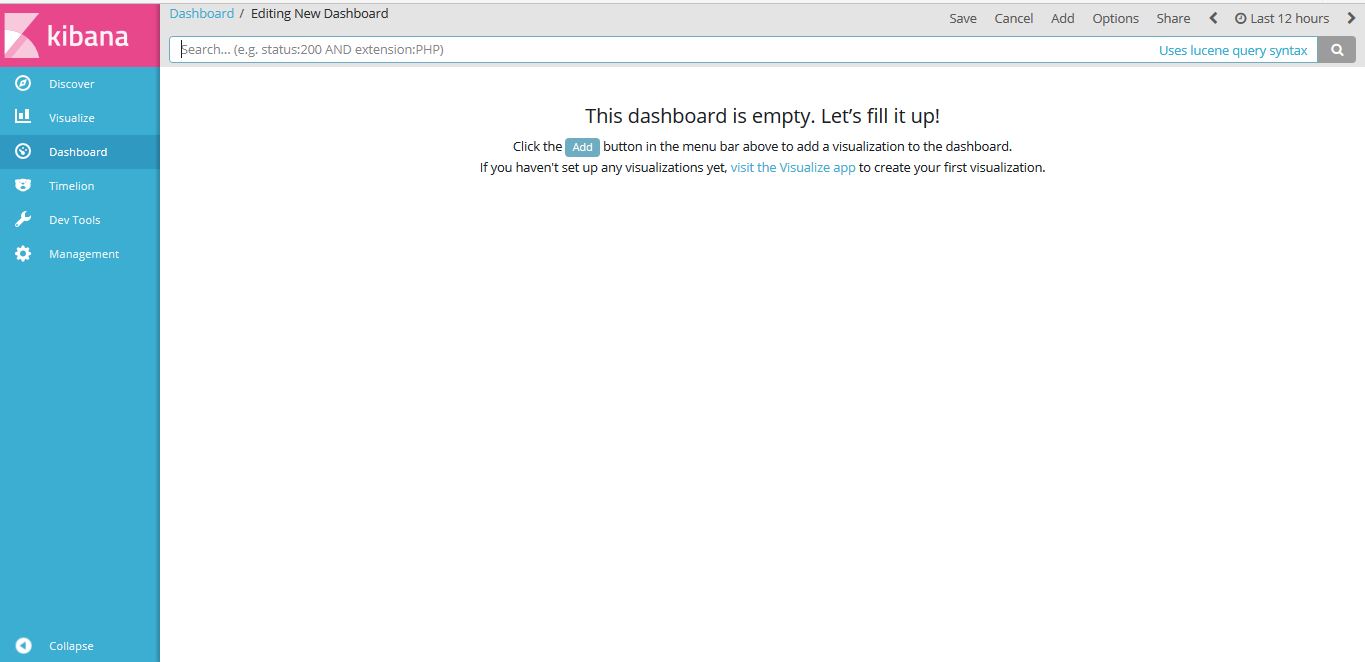
click on Visit the Visualize app
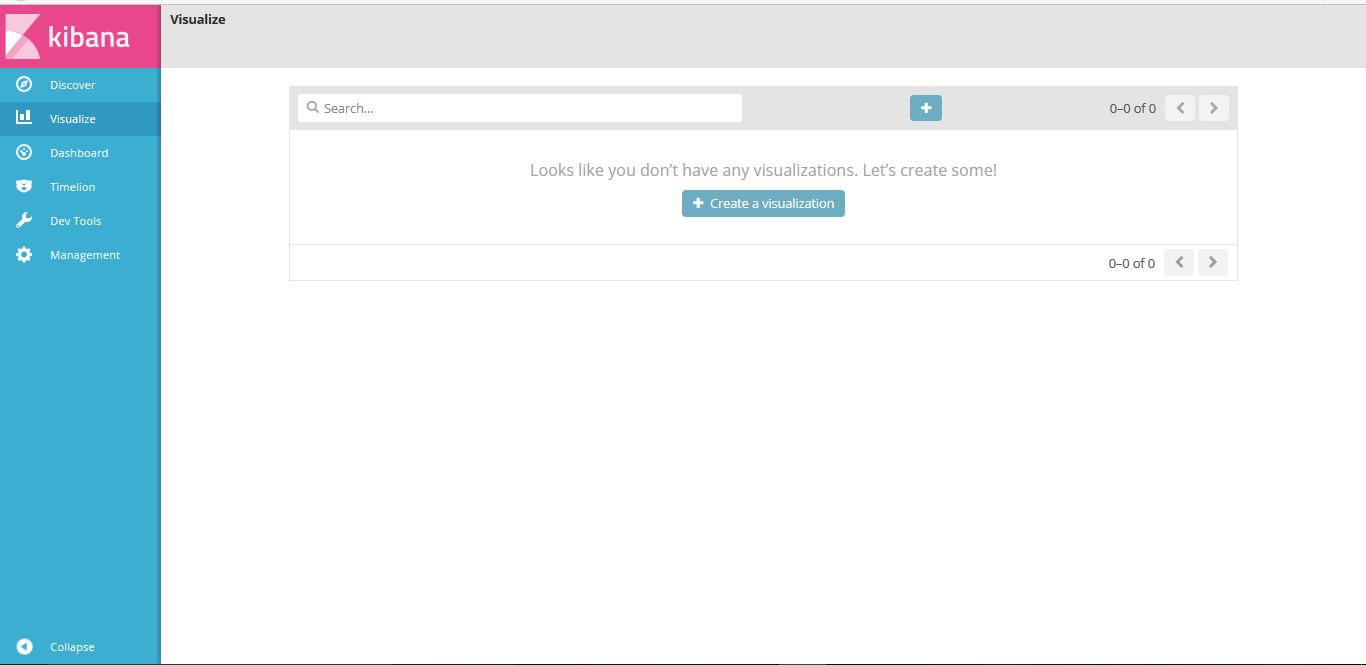
click on “Create a visualization” or “+”(i.e Plus sign) show in the search bar.
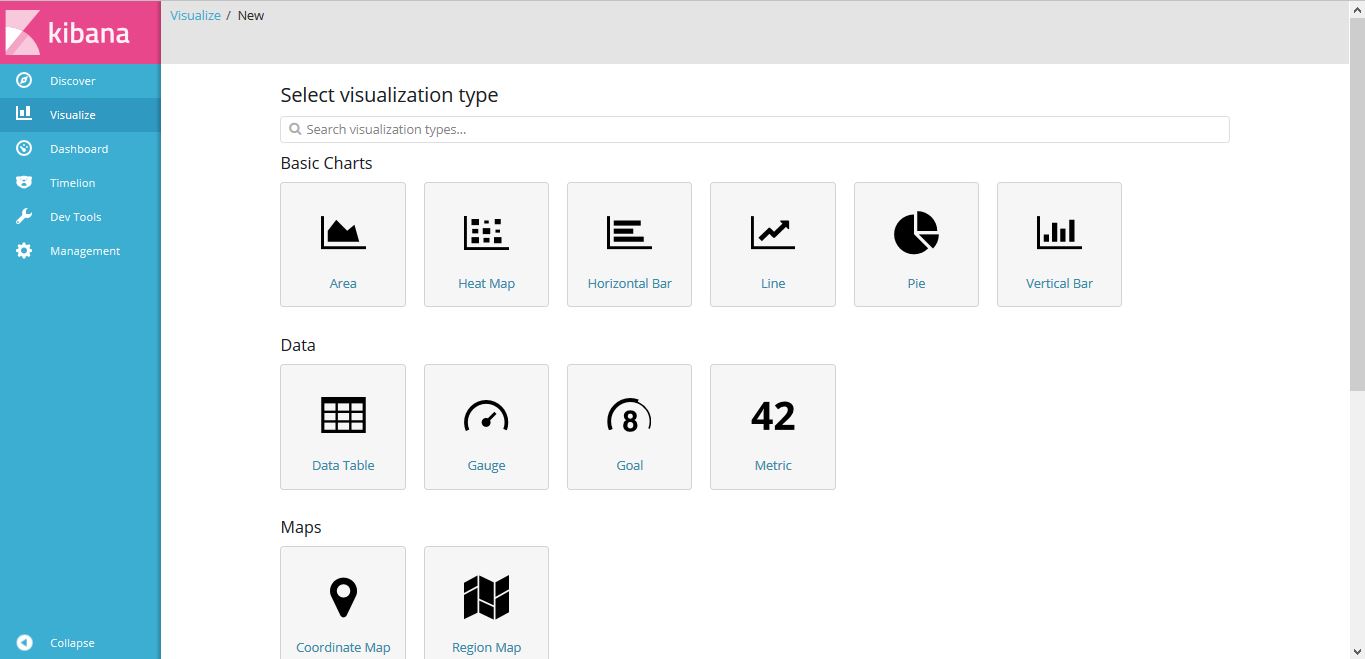
Select visualization type. For example click on “Pie”.
Choose search source as logstash-*
Click on Split Slices
Select Aggregation as “Terms” and Field as “userAgent.keyword”, Click on “Apply changes”
Note: Elasticsearch aggregations are to extract and process your data.
To save this chart click on “Save”, Enter a name appropriate name. For example “Acumos User Login”.
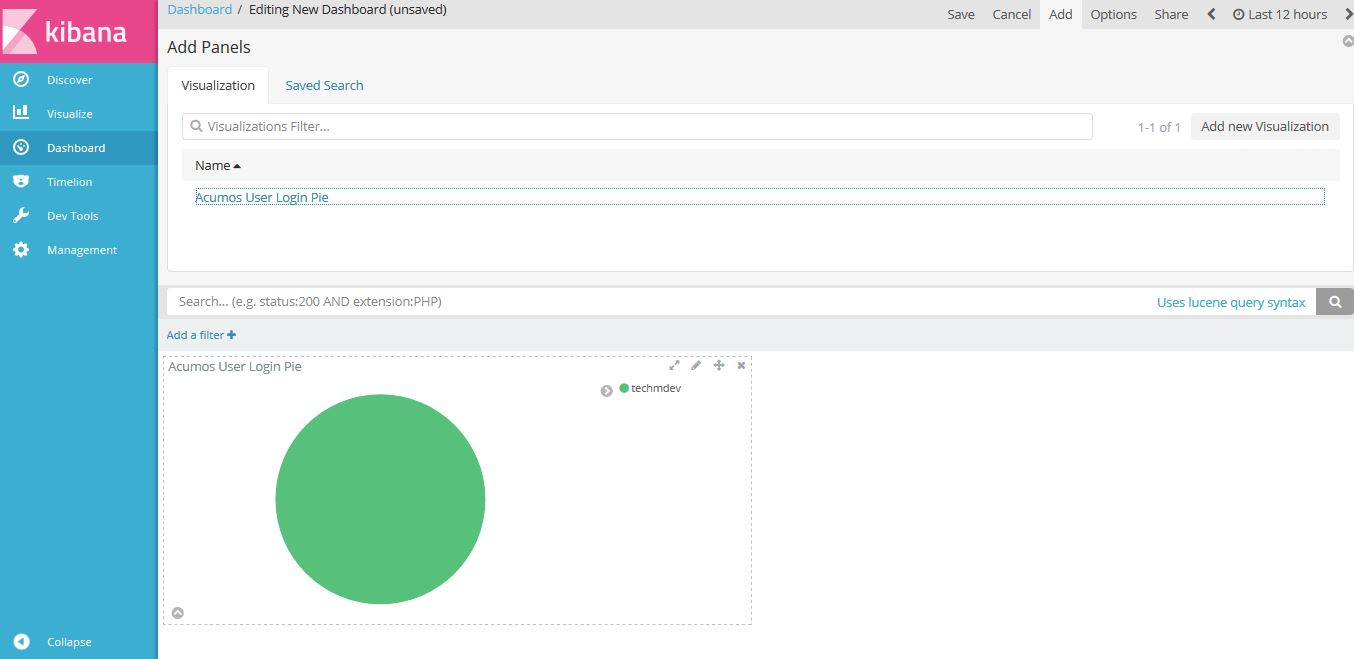
Click on “Dashboard”, On the below screen visualization namely “Acumos User Login” is appearing. For select this visualization click on “+” (i.e. plus sign) show in the search bar.
Click on “Add” button, to add the visualization.
Select the visualization for example here we have visualization namely “Acumos User Login”.
Click on “Save” button. Enter a name appropriate name. For example “Acumos User Login”.
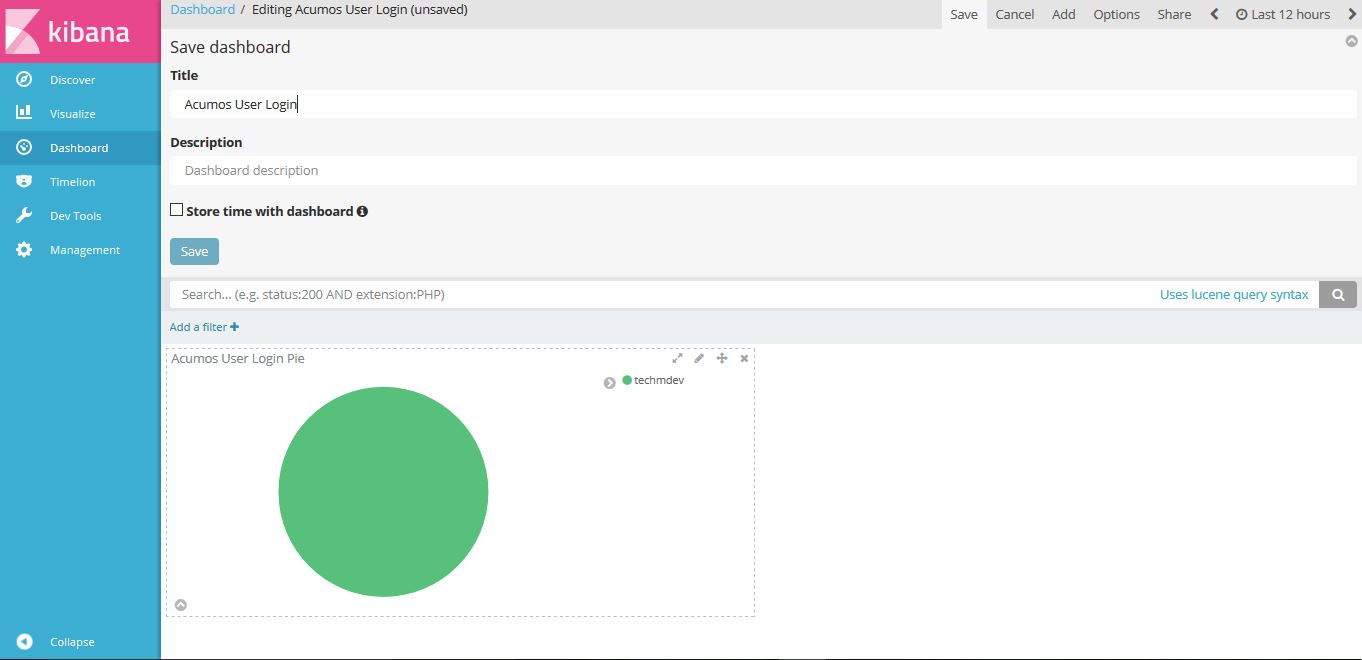
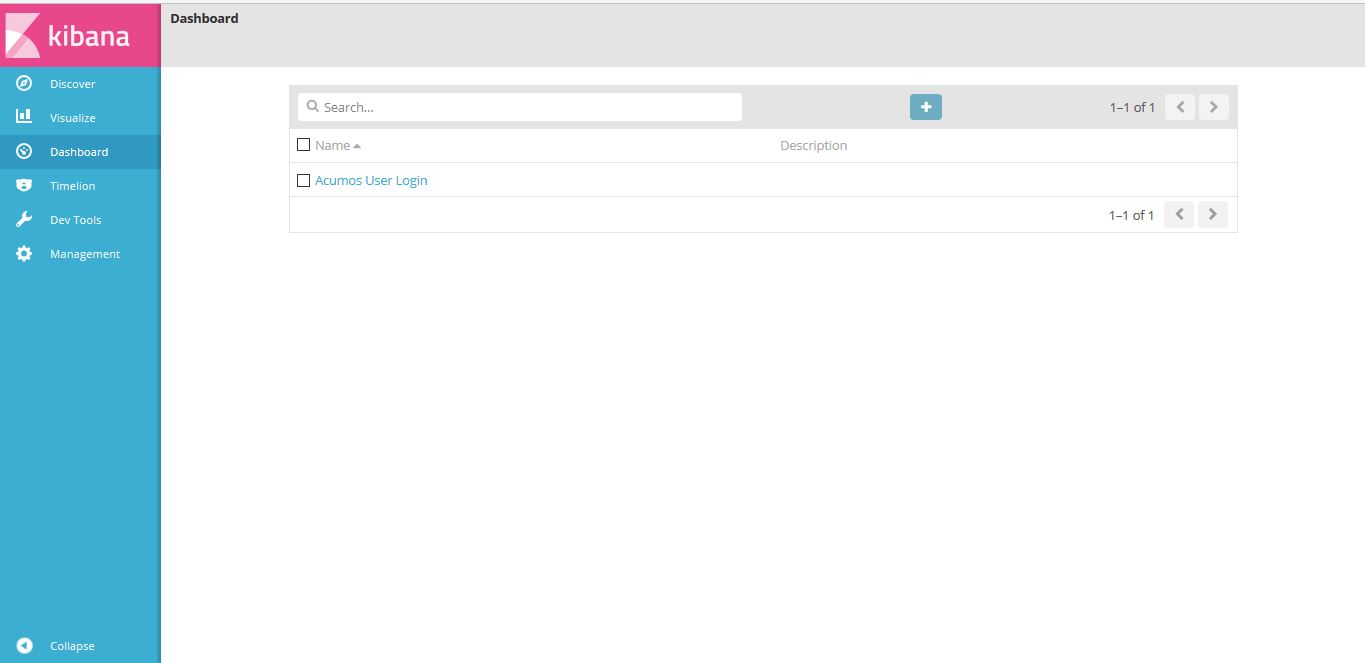
Click on “Dashboard”, On the below screen created dashboard can be viewed namely “Acumos User Login”.
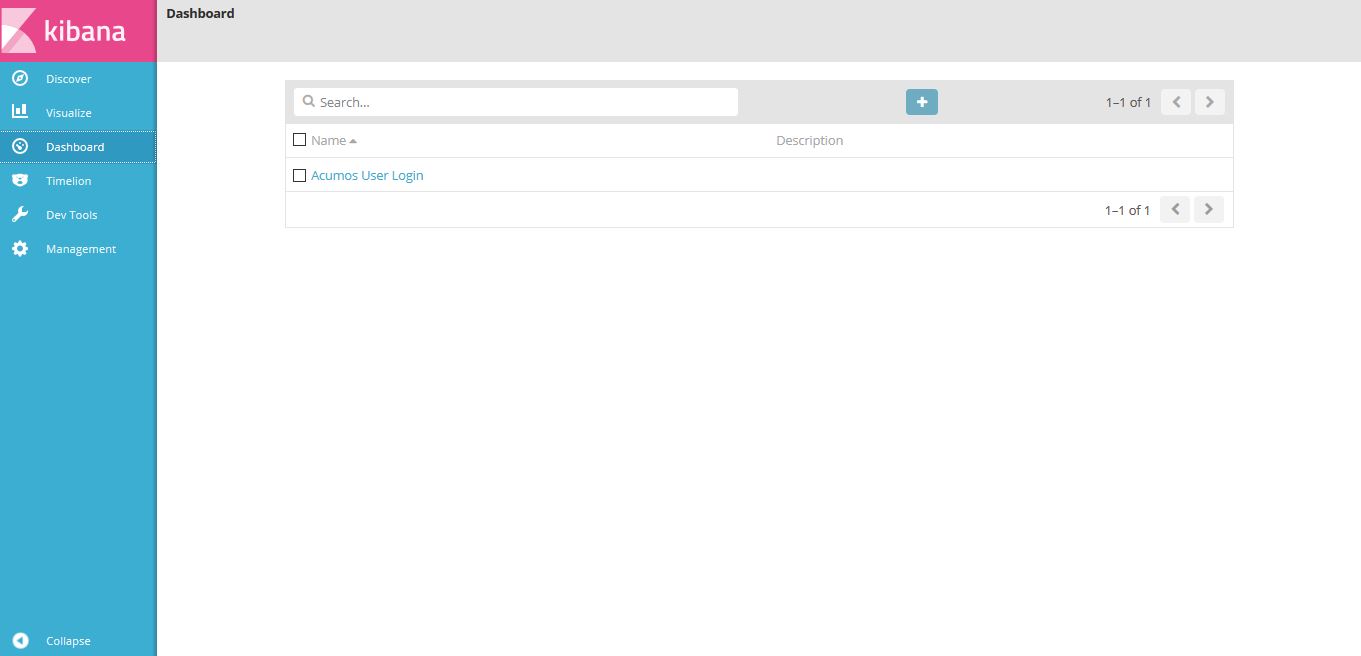
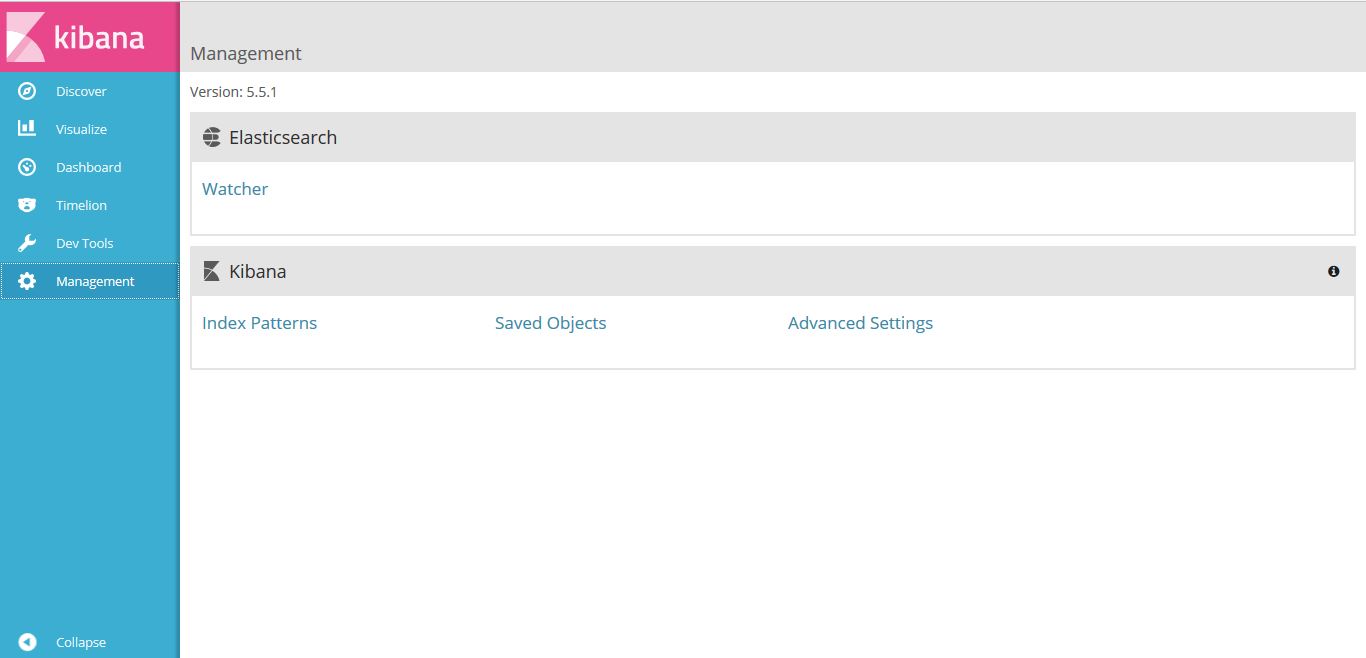
Acumos Kibana Dashboard Save
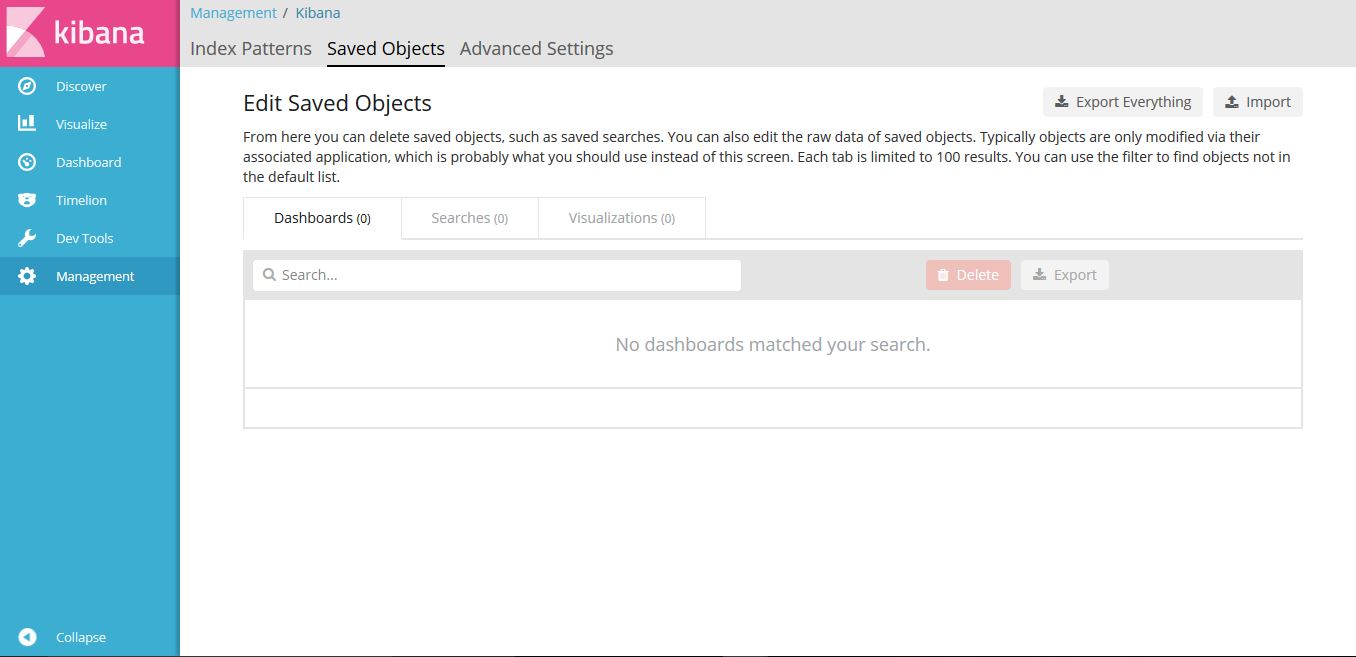
Click on “Management”, On the below screen click on save object.
Click on “Export Everything” to export the dashboard and “Import” to import the saved dashboard.
Note
export/import document should be in JSON format.
An example JSON file that can be used to import a Dashboard is available in the platform-oam repo, elk-stack directory.