Model Usage Tracking - Composite Model
Composite Model deployment (Kubernetes cluster)
In this section, we will refer to composite model “detect-pixelate”.
Deploying model
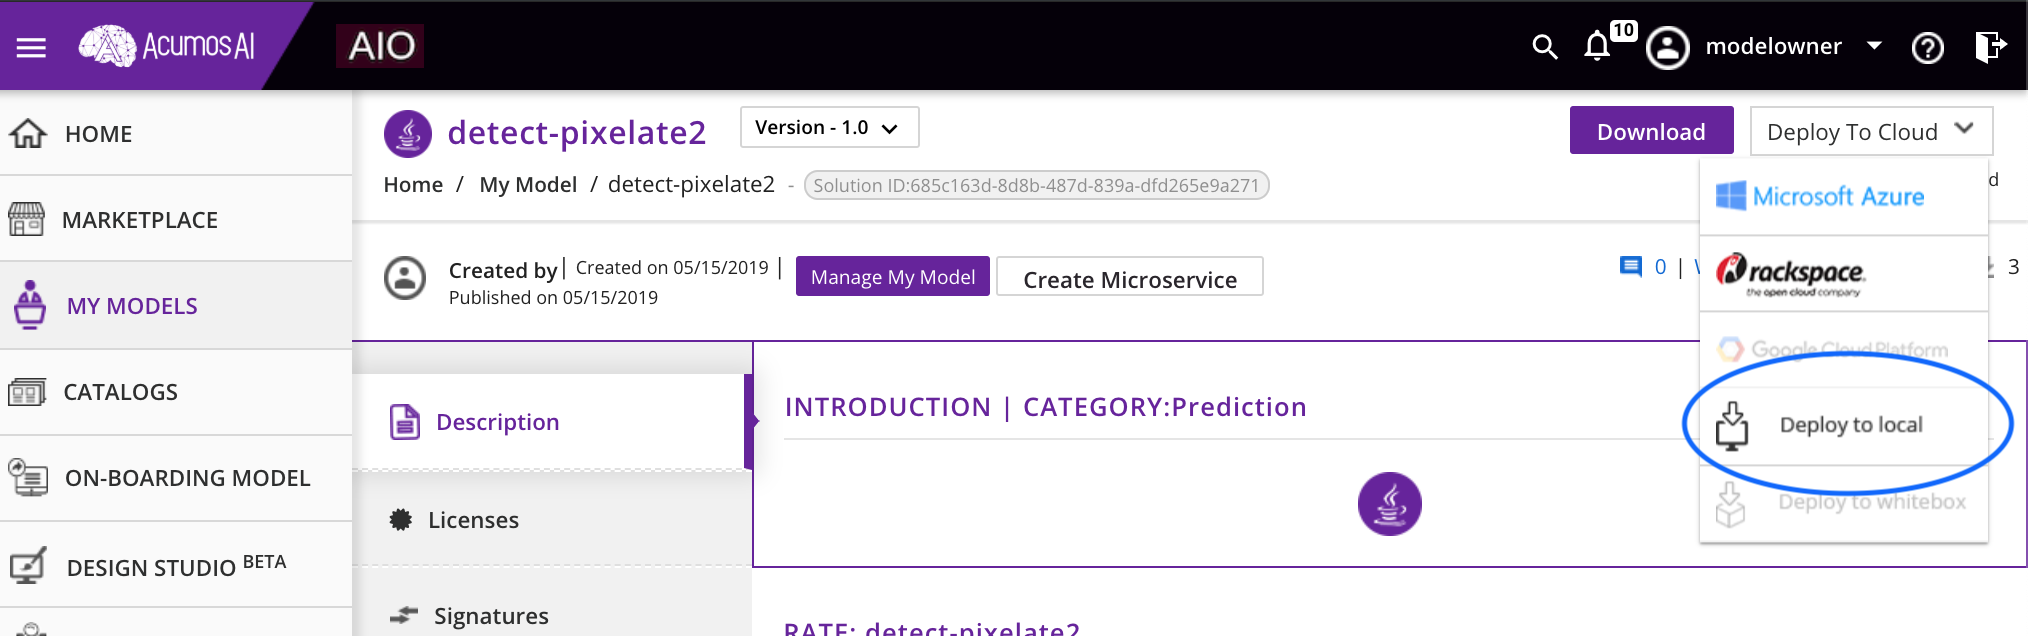
Once a Composite AI model onboarded to Acumos platform, you can download the solution using the “Deploy to Local” feature.
Click the “Download Solution Package” button to download the model solution package for deployment.
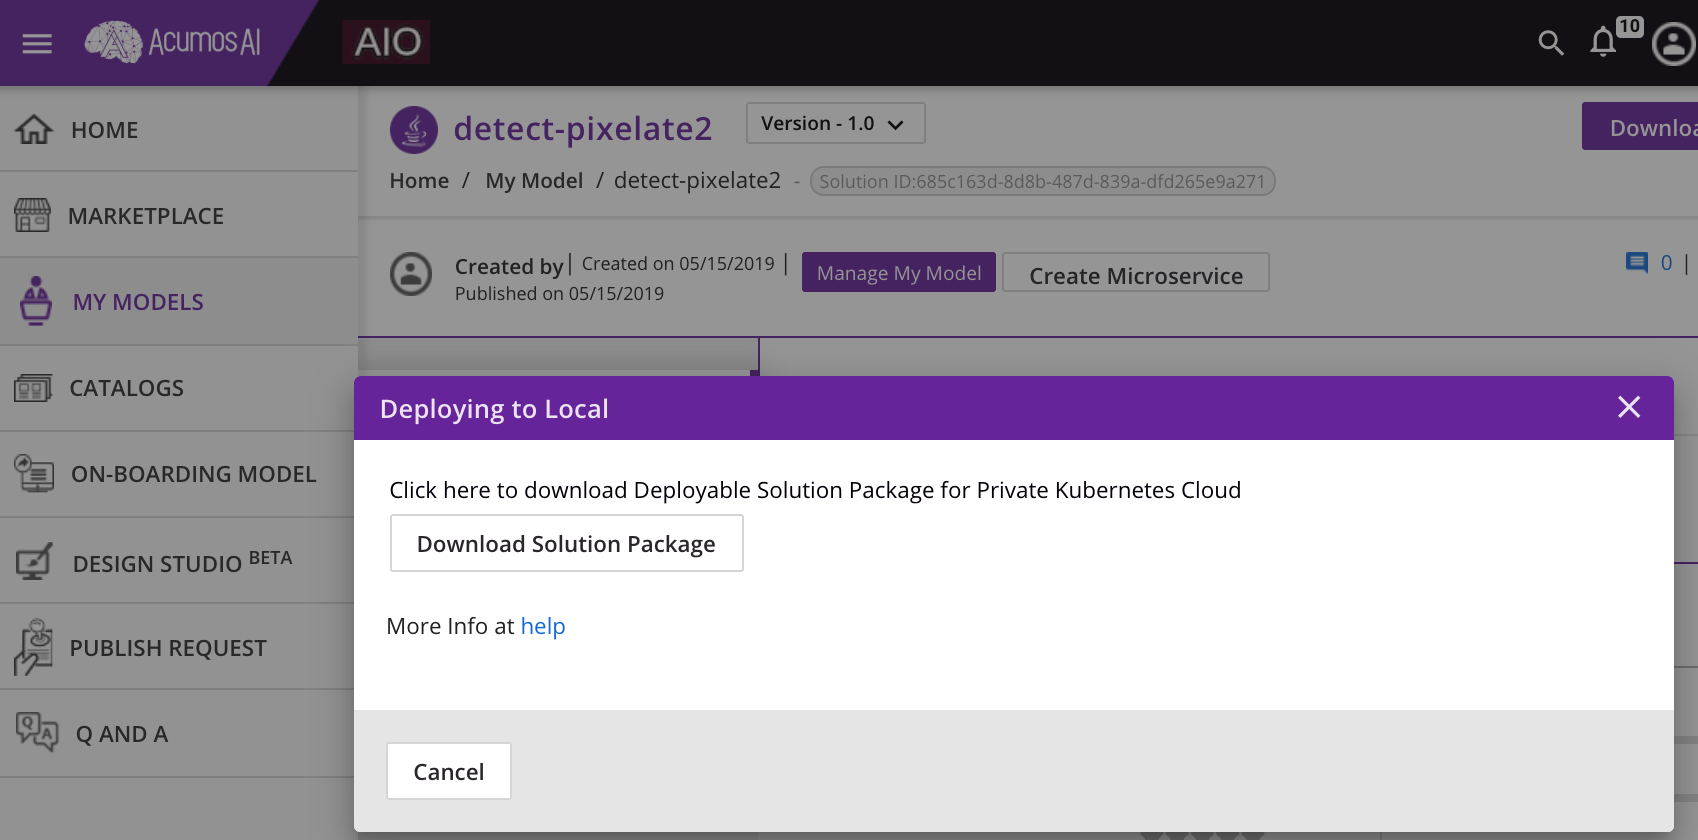
You will notice following artifacts from the downloaded solution package.
ls -al
total 48
drwxrwxr-x  3 acumos acumos  4096 Jun  4 17:15 .
drwxrwxr-x 13 acumos acumos  4096 Jun  4 17:15 ..
-rw-rw-r--  1 acumos acumos  1253 Jun  1 01:19 blueprint.json
-rw-rw-r--  1 acumos acumos 15992 Jun  1 01:19 deploy.sh
-rw-rw-r--  1 acumos acumos   602 Jun  1 01:19 deploy_env.sh
-rw-rw-r--  1 acumos acumos   318 Jun  1 01:19 dockerinfo.json
drwxrwxr-x  4 acumos acumos  4096 Jun  4 17:15 microservice
-rw-rw-r--  1 acumos acumos  3291 Jun  1 01:19 setup_k8s.sh
-rw-rw-r--  1 acumos acumos  2672 Jun  1 01:19 solution.yaml
Deploy the model solution to your Kubernetes cluster using following command:
bash deploy.sh <user> <pass> <namespace> [datasource]
  user: username on the Acumos platform
  pass: password on the Acumos platform
  namespace: Kubernetes namespace to deploy the solution under
  datasource: (optional) file path or URL of data source for databroker
For example, deploying the model solution under the namespace “cmp6” would result in following running services:
kubectl get pods,svc -n cmp5
NAME                                                             READY   STATUS    RESTARTS   AGE
pod/face-privacy-filter-detect1-6469c75d65-kg4xz                 1/1     Running   0          3m1s
pod/face-privacy-filter-pixelate1-5bcc7dc9cc-cm2zh               1/1     Running   0          3m1s
pod/filebeat-gqm5h                                               1/1     Running   0          2m49s
pod/modelconnector-668544dffc-8xr9b                              1/1     Running   0          3m1s
pod/nginx-proxy-face-privacy-filter-detect1-6c7dd4b87f-pg6mc     1/1     Running   0          2m47s
pod/nginx-proxy-face-privacy-filter-pixelate1-576b955888-k5hsp   1/1     Running   0          2m46s
pod/nginx-proxy-mc-69dbf6b57d-b64kd                              1/1     Running   0          2m45s

NAME                                                TYPE        CLUSTER-IP       EXTERNAL-IP   PORT(S)          AGE
service/face-privacy-filter-detect1                 ClusterIP   10.109.14.143    <none>        8556/TCP         3m1s
service/face-privacy-filter-pixelate1               ClusterIP   10.105.171.201   <none>        8556/TCP         3m1s
service/modelconnector                              NodePort    10.100.82.40     <none>        8555:30555/TCP   3m1s
service/nginx-proxy-face-privacy-filter-detect1     ClusterIP   10.105.159.42    <none>        8550/TCP         2m48s
service/nginx-proxy-face-privacy-filter-pixelate1   ClusterIP   10.96.232.124    <none>        8550/TCP         2m46s
service/nginx-proxy-mc                              NodePort    10.97.54.240     <none>        8550:30550/TCP   2m45s
- NOTE:
- To enable model usage tracking, there is a new nginx-proxy service for each model - composite and source models.
- The nginx-proxy for model connector runs on port 30550.
Running model
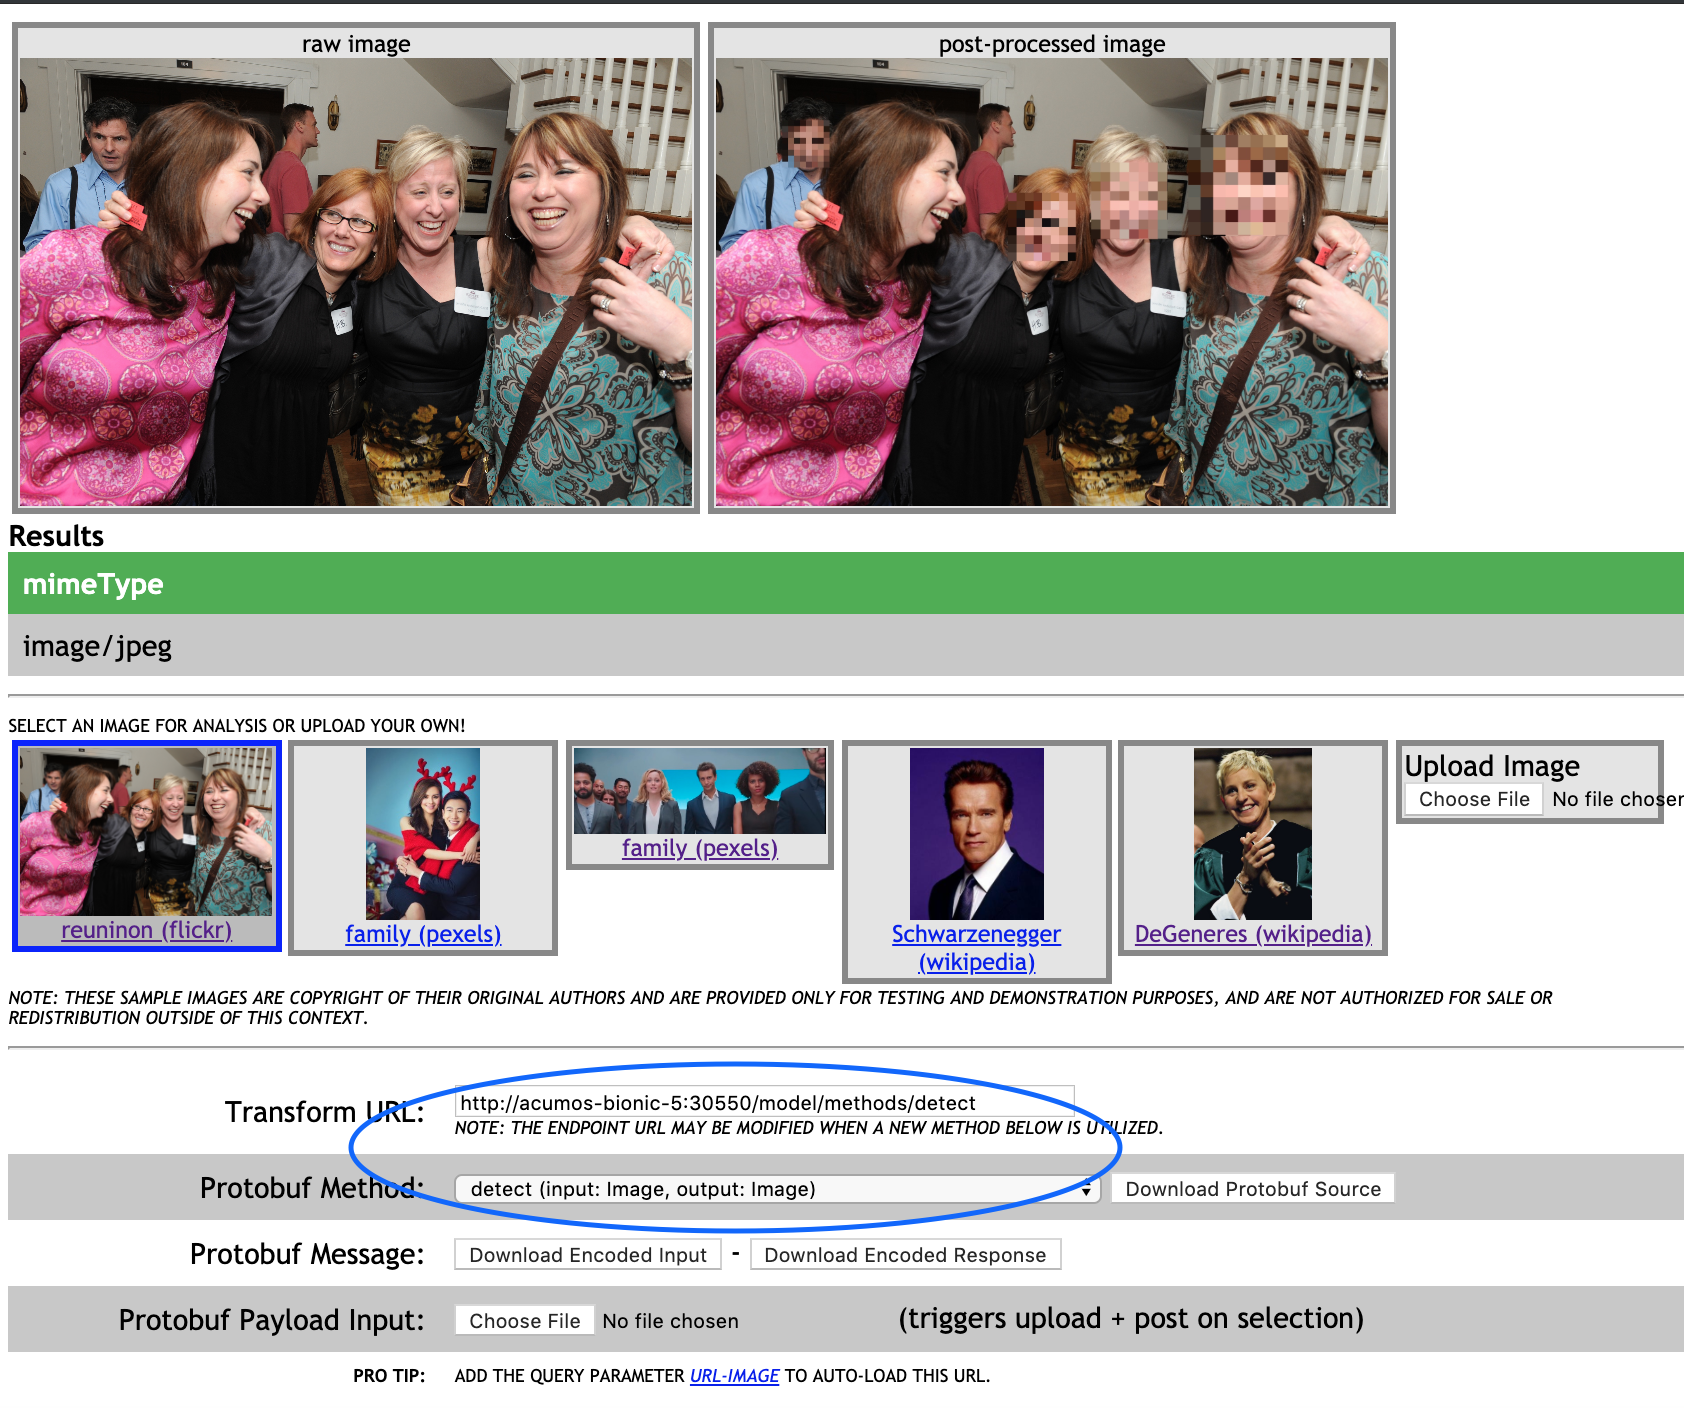
With Boreas release, the AI model can be accessed (via model runner) using following URL pattern:
http://<model-runner-host>:<nginx-model-svc-port>/model/methods/<methodName>
You can get method name from the protobuf rpc section.
For the example composite model “detect-pixelate”, it would be
http://<model-runner-host>:30550/model/methods/detect
- NOTE:
- The nginx reverse proxy for composite model is exposed on port 30550.
- The new model runner takes protobuf as accept and content-type i.e. Accept: application/vnd.google.protobuf and Content-Type: application/vnd.google.protobuf
Access model usage logs in Kibana
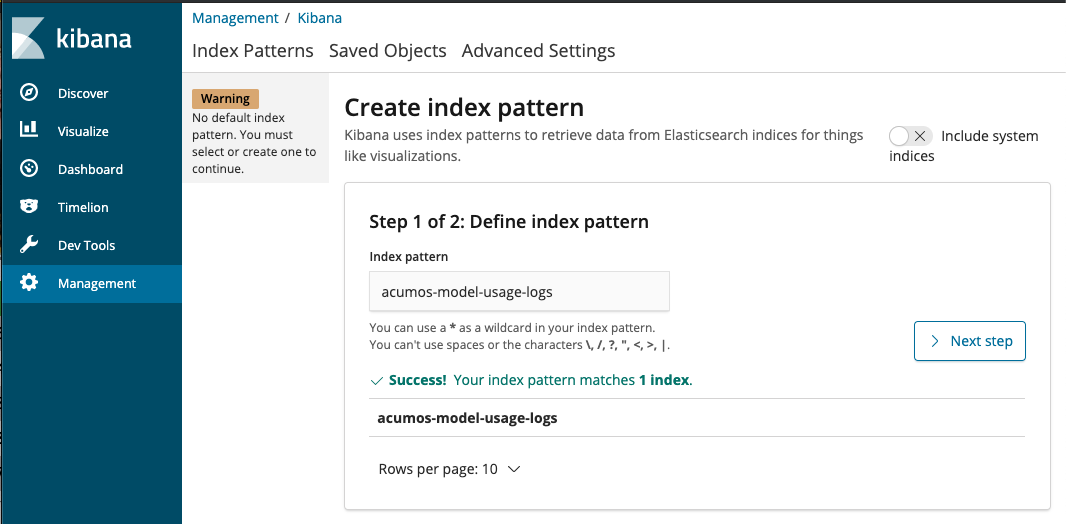
The usage data for all models in composite model are submitted to Acumos platform Elastic Stack. The Acumos platform Elastic Search service stores model usage data with the index name “acumos-model-usage-logs”.
Admin can login to Kibana Dashboard and create index pattern “acumos-model-usage-logs” with Time Filter field “@timestamp”.
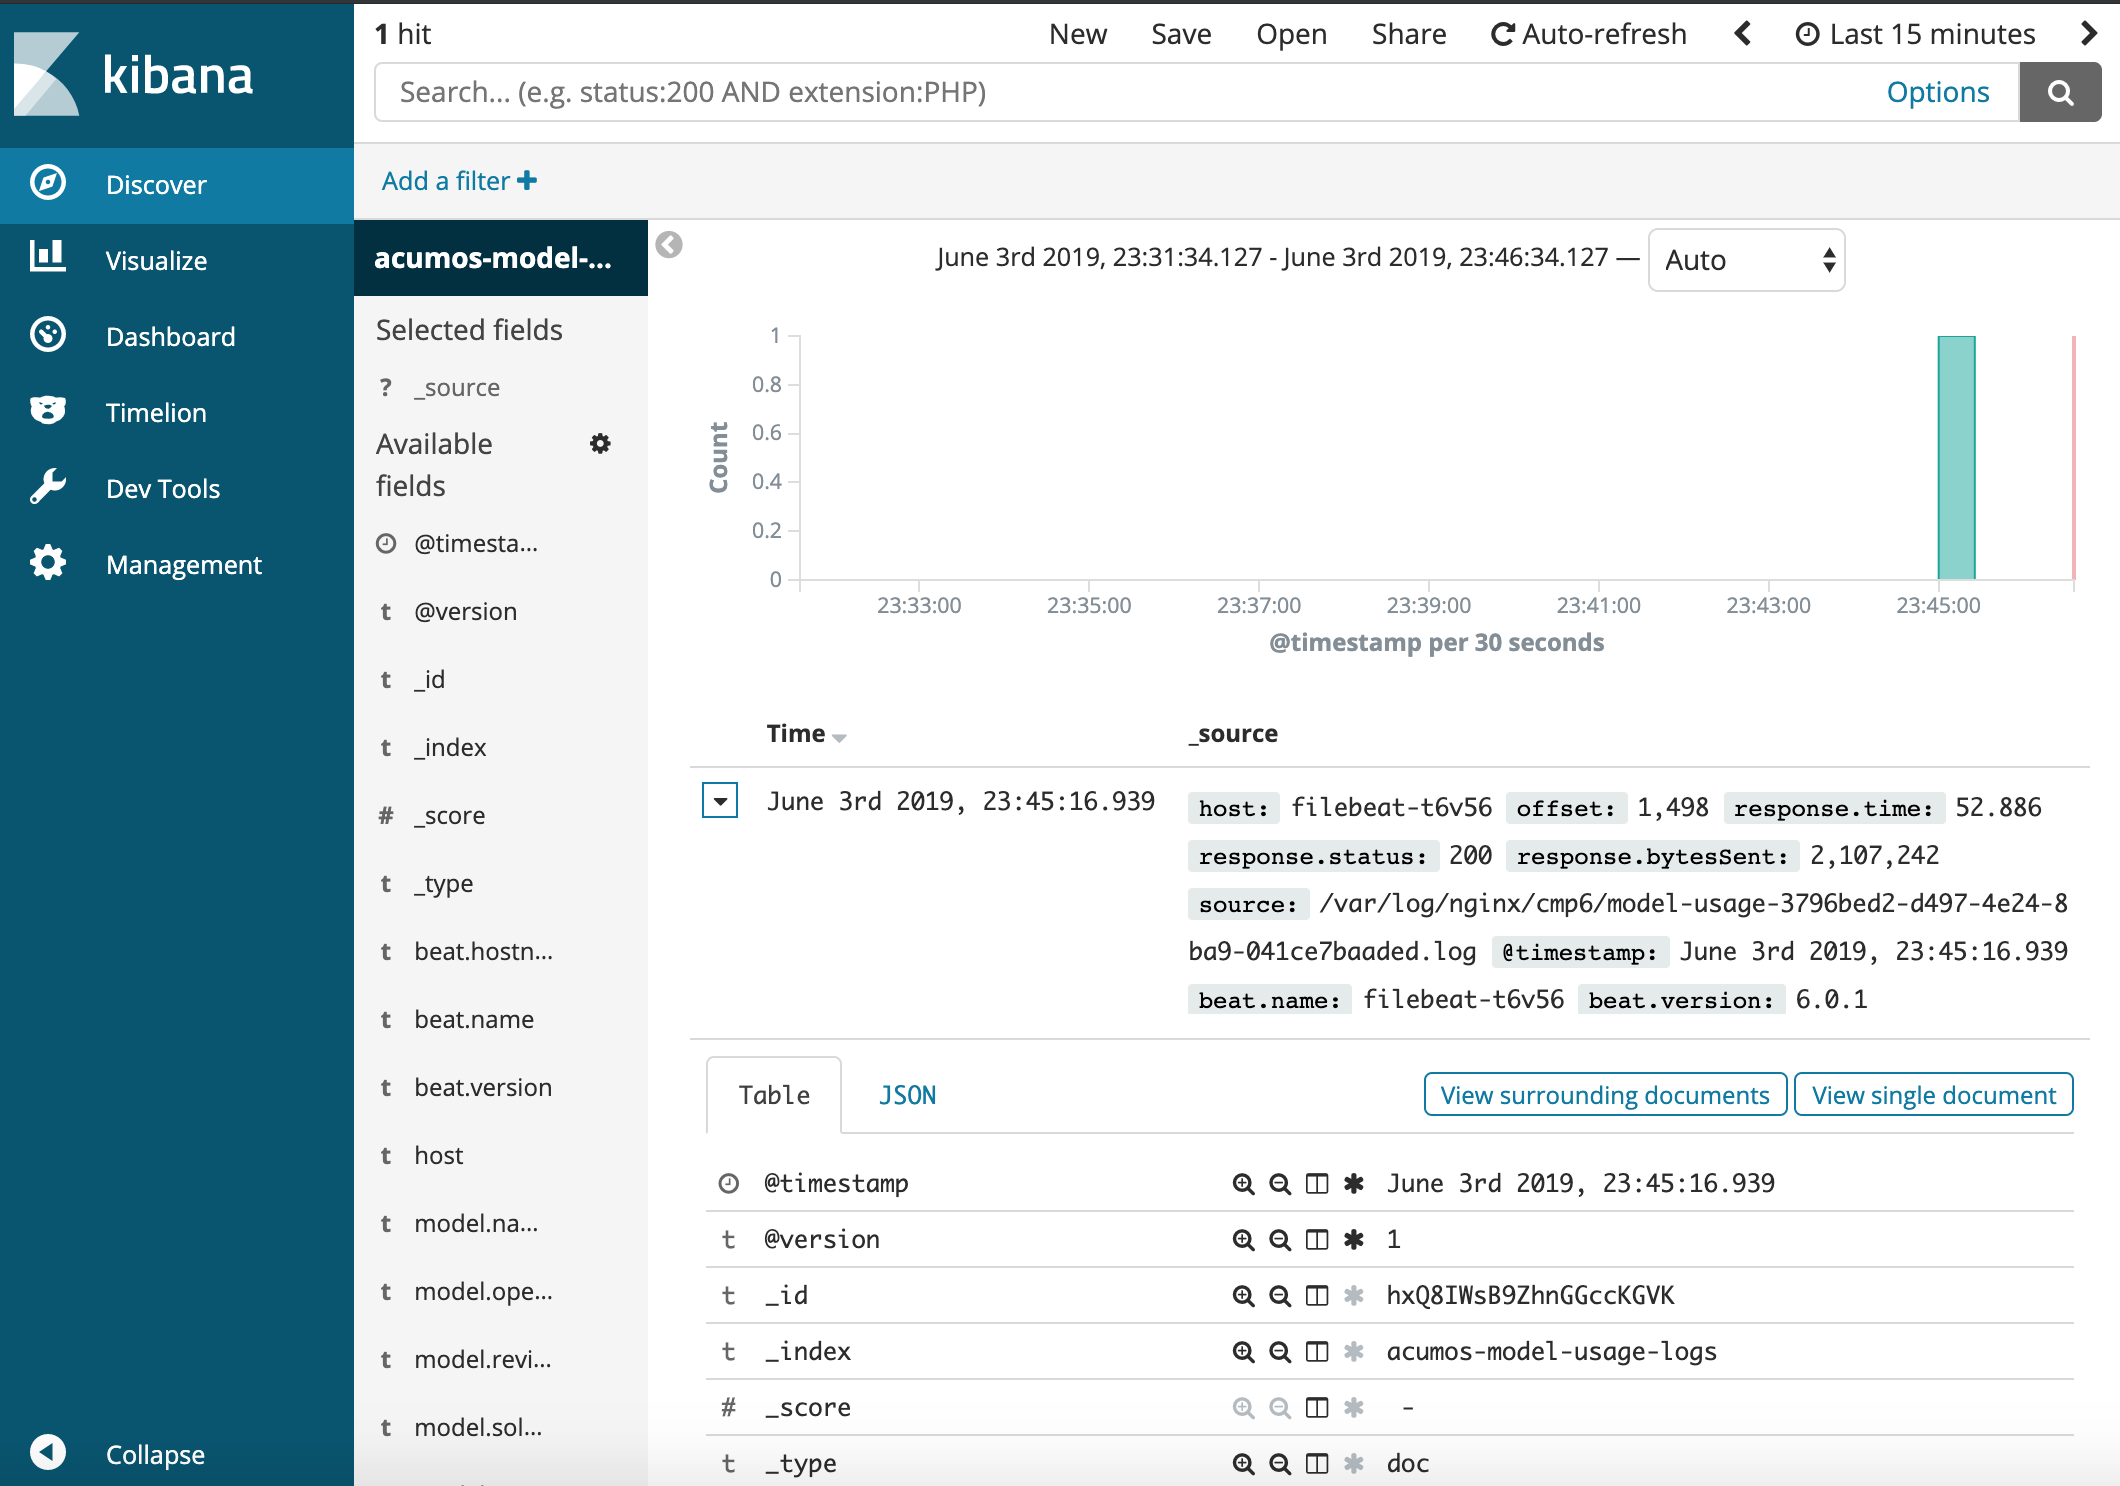
After adding the “acumos-model-usage-logs” index pattern, switch to the Discover tab to search the model usage records at different time intervals.
As an Admin, you can observe the requested model usage data along with request/response details logged by nginx reverse proxy service.
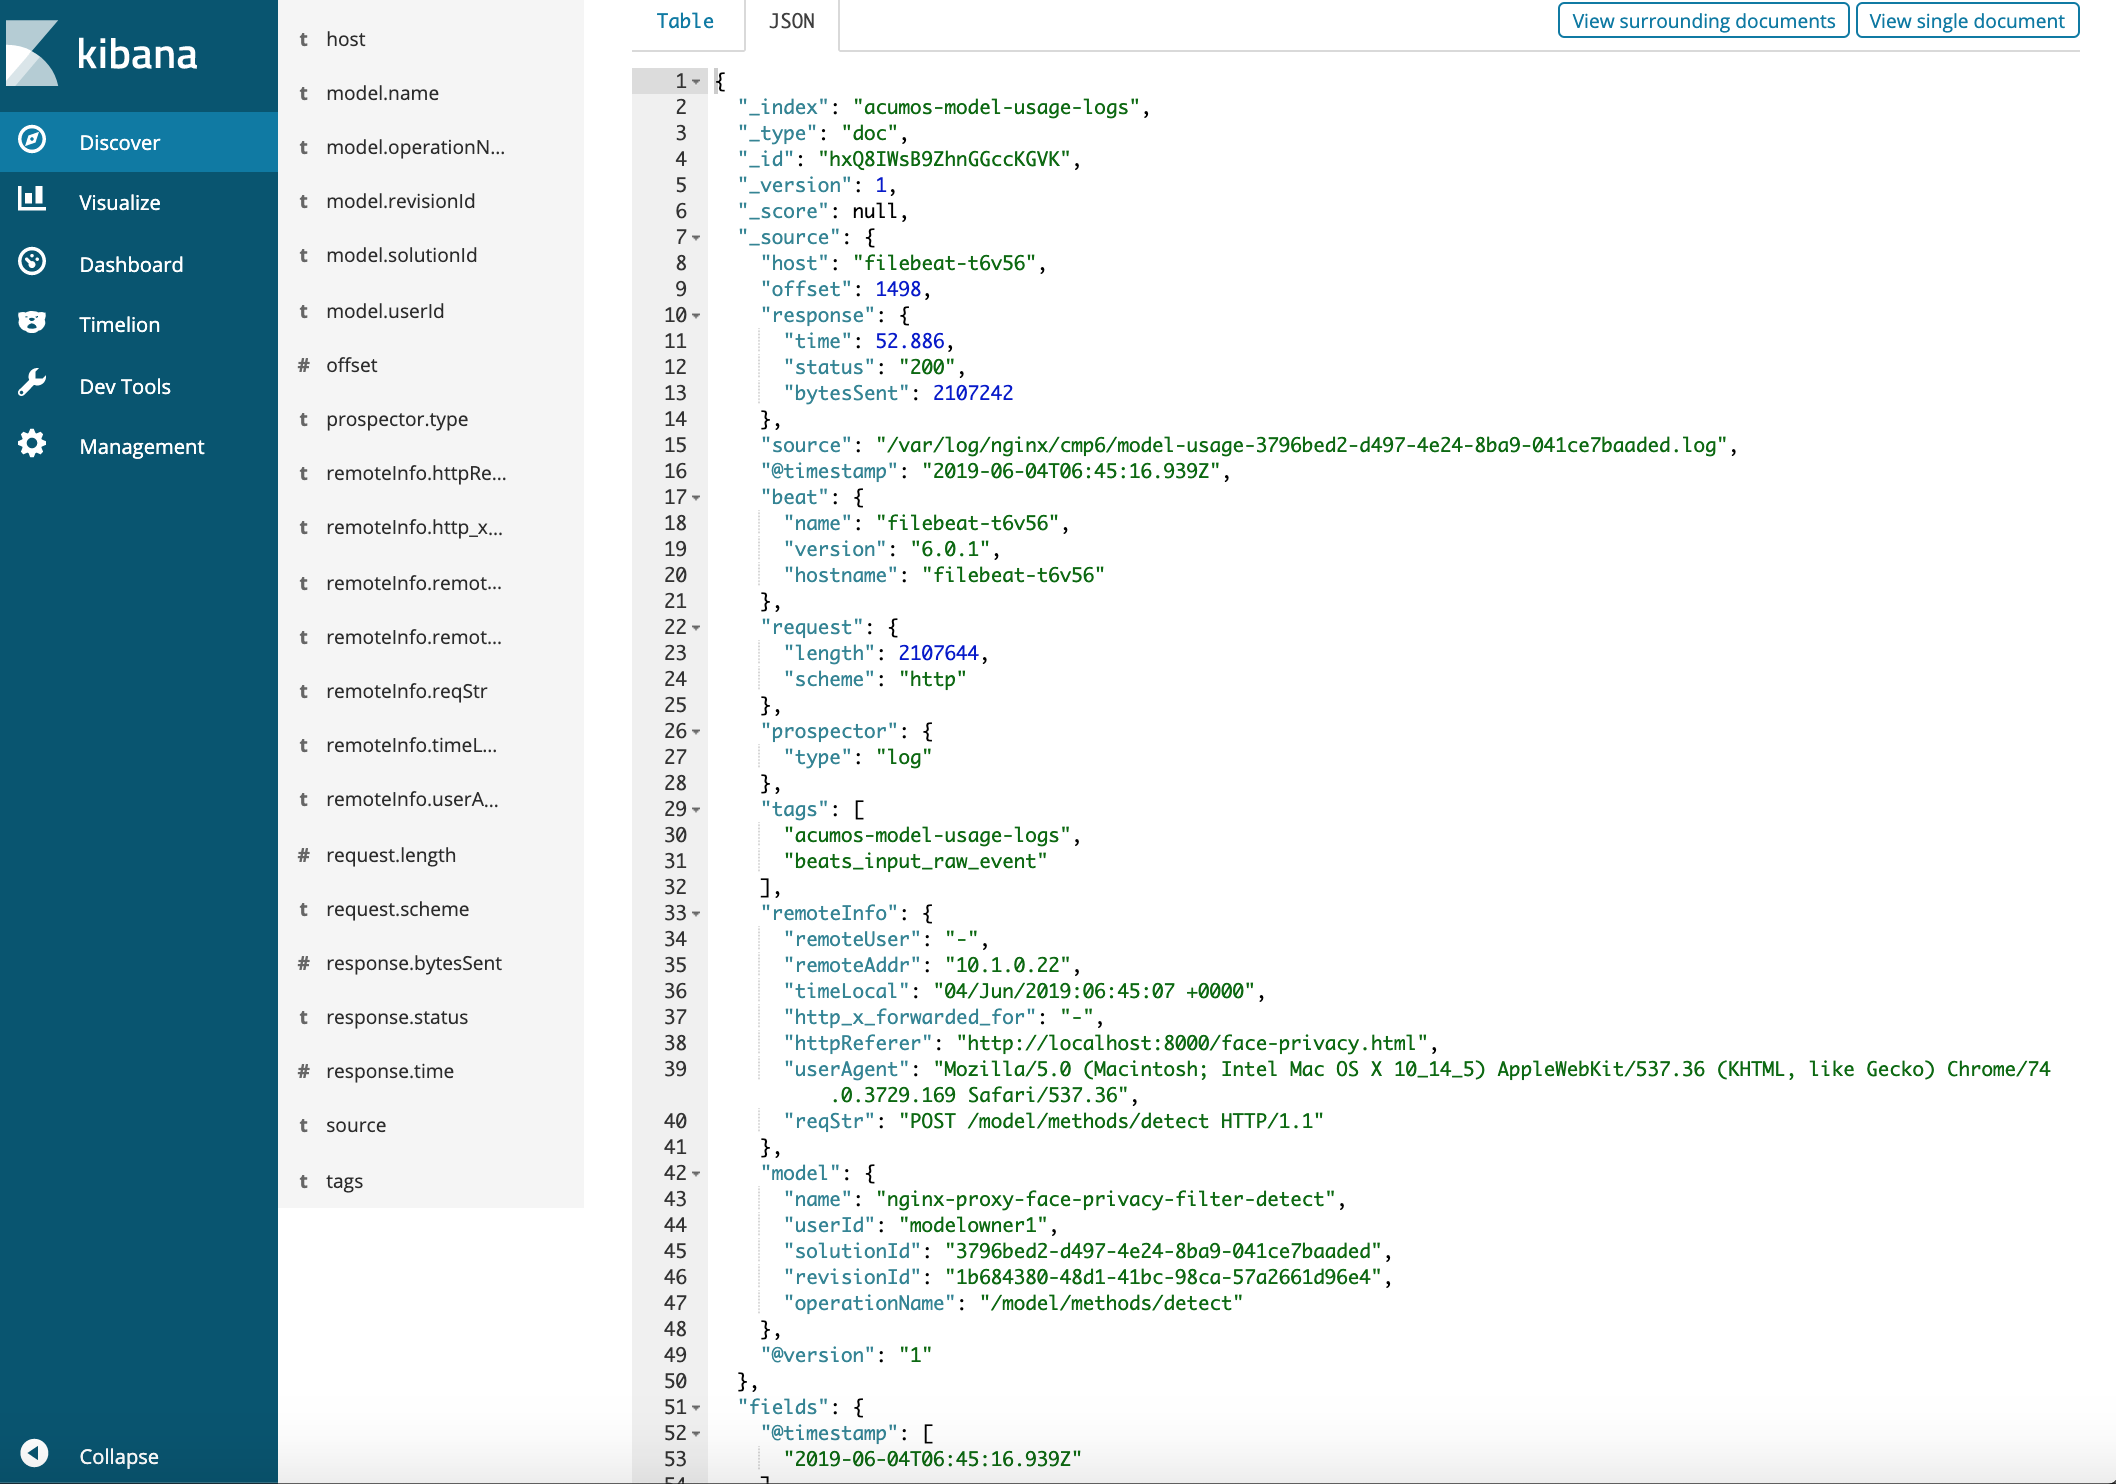
Switch to the JSON tab of any record to review the raw json data of model usage record.
Admin can create Visual Objects based on different visualization types.
In this Guide, we will create Visualization to show usage metrics of face-privacy-filter detect, pixelate and detect-pixelate composite models.
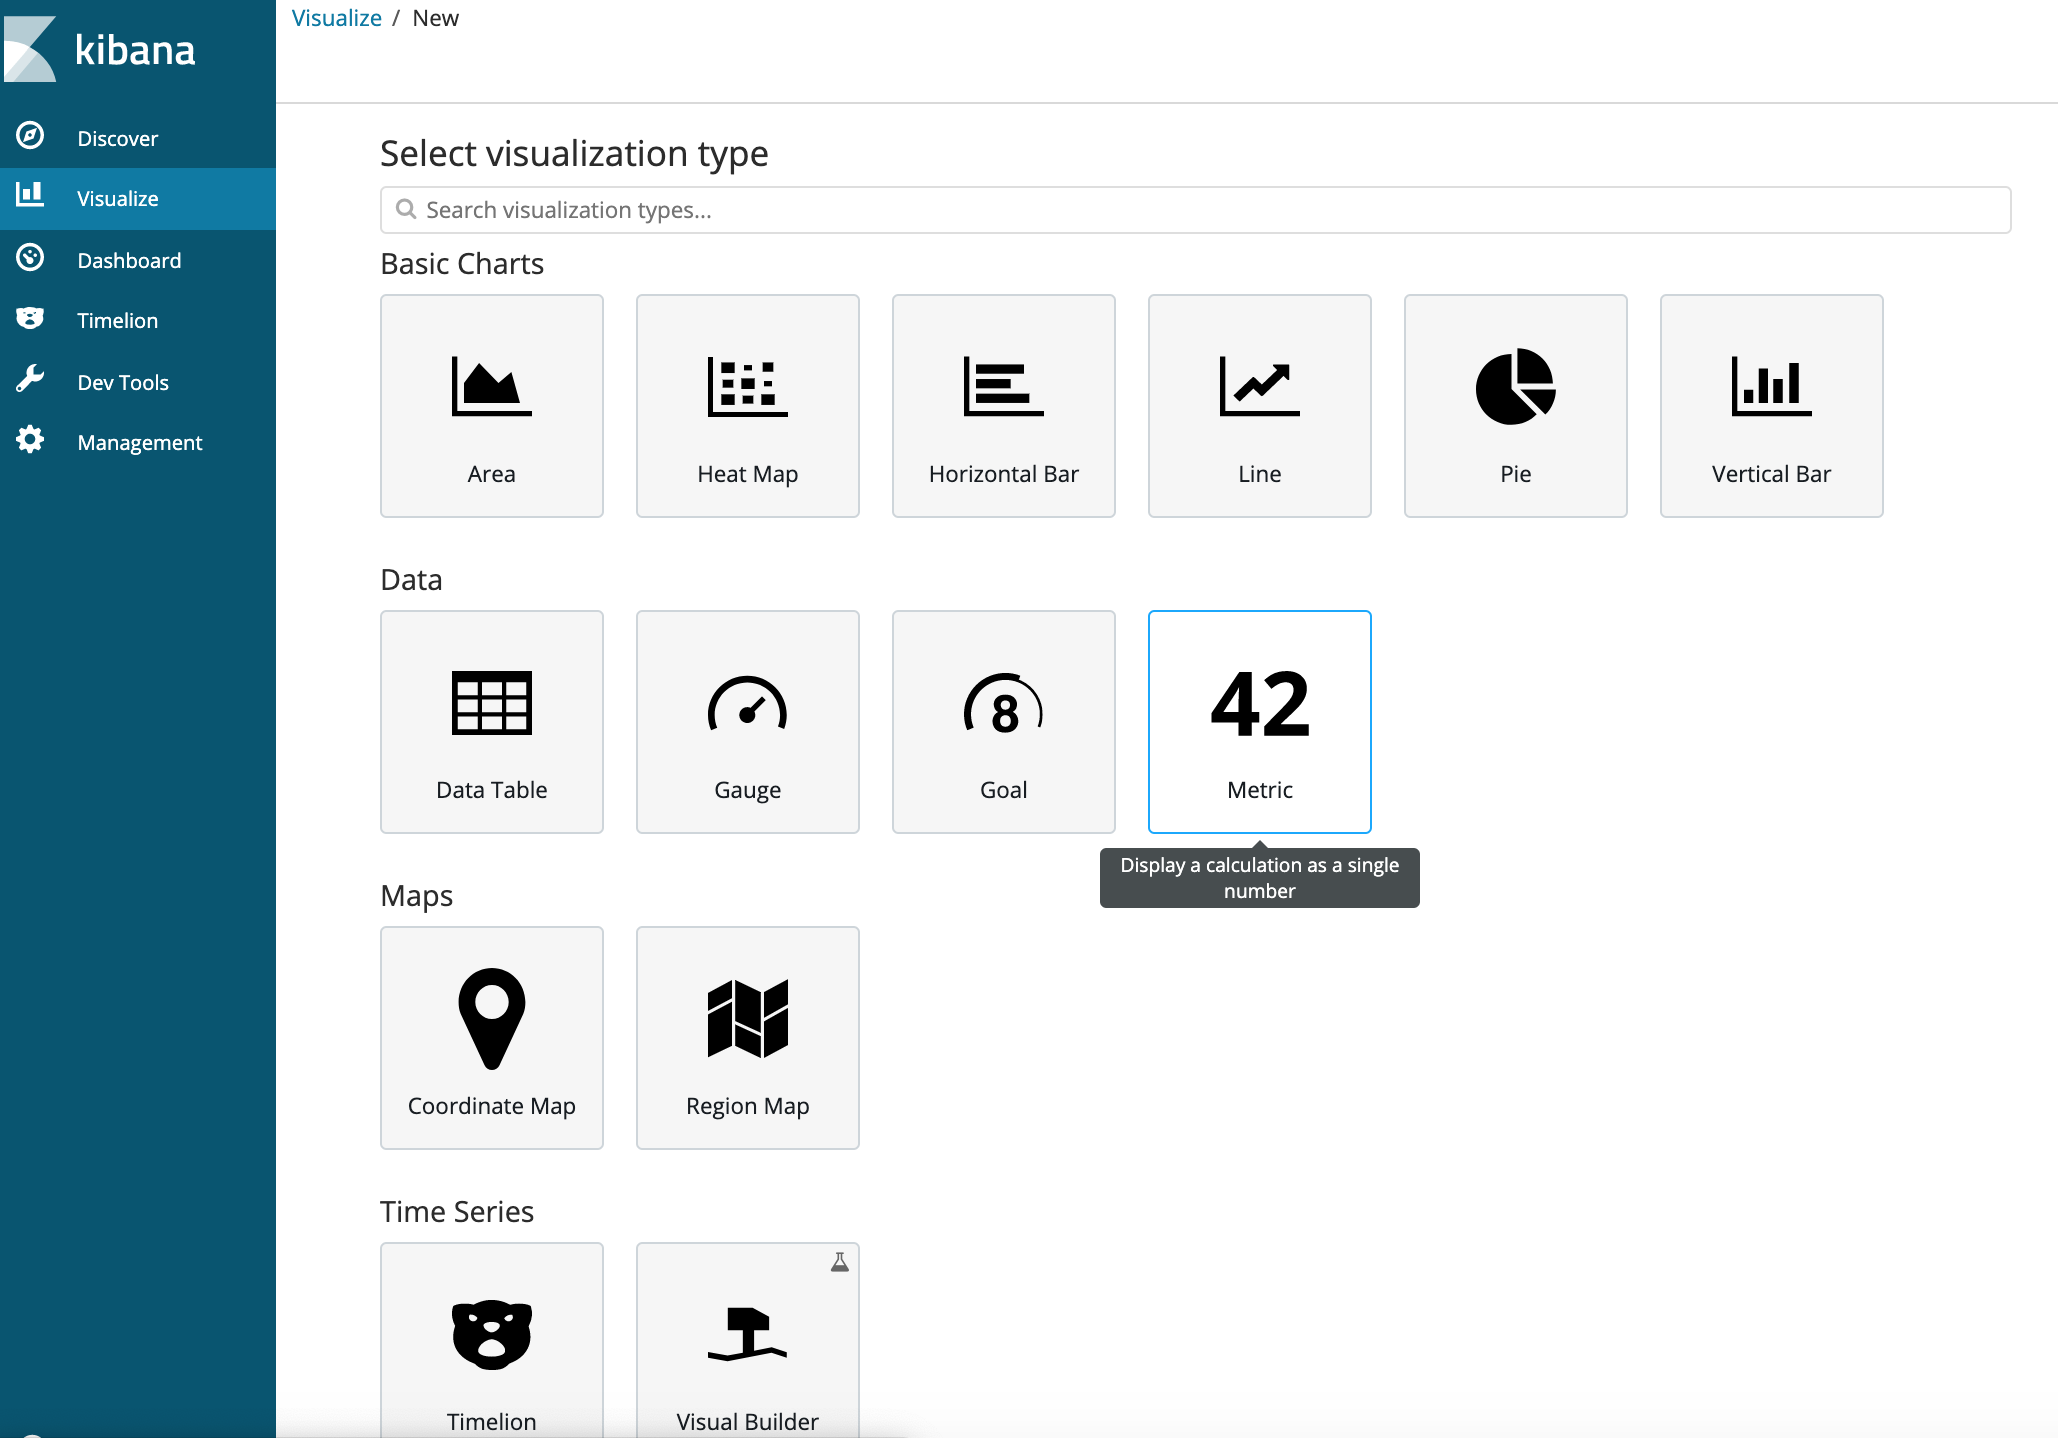
To create Metrics visualization,
- Select “acumos-model-usage-logs” as search source.
- Under Buckets section, click “Split Group”.
- Under Aggregation dropdown, select “Filter” aggregation type.
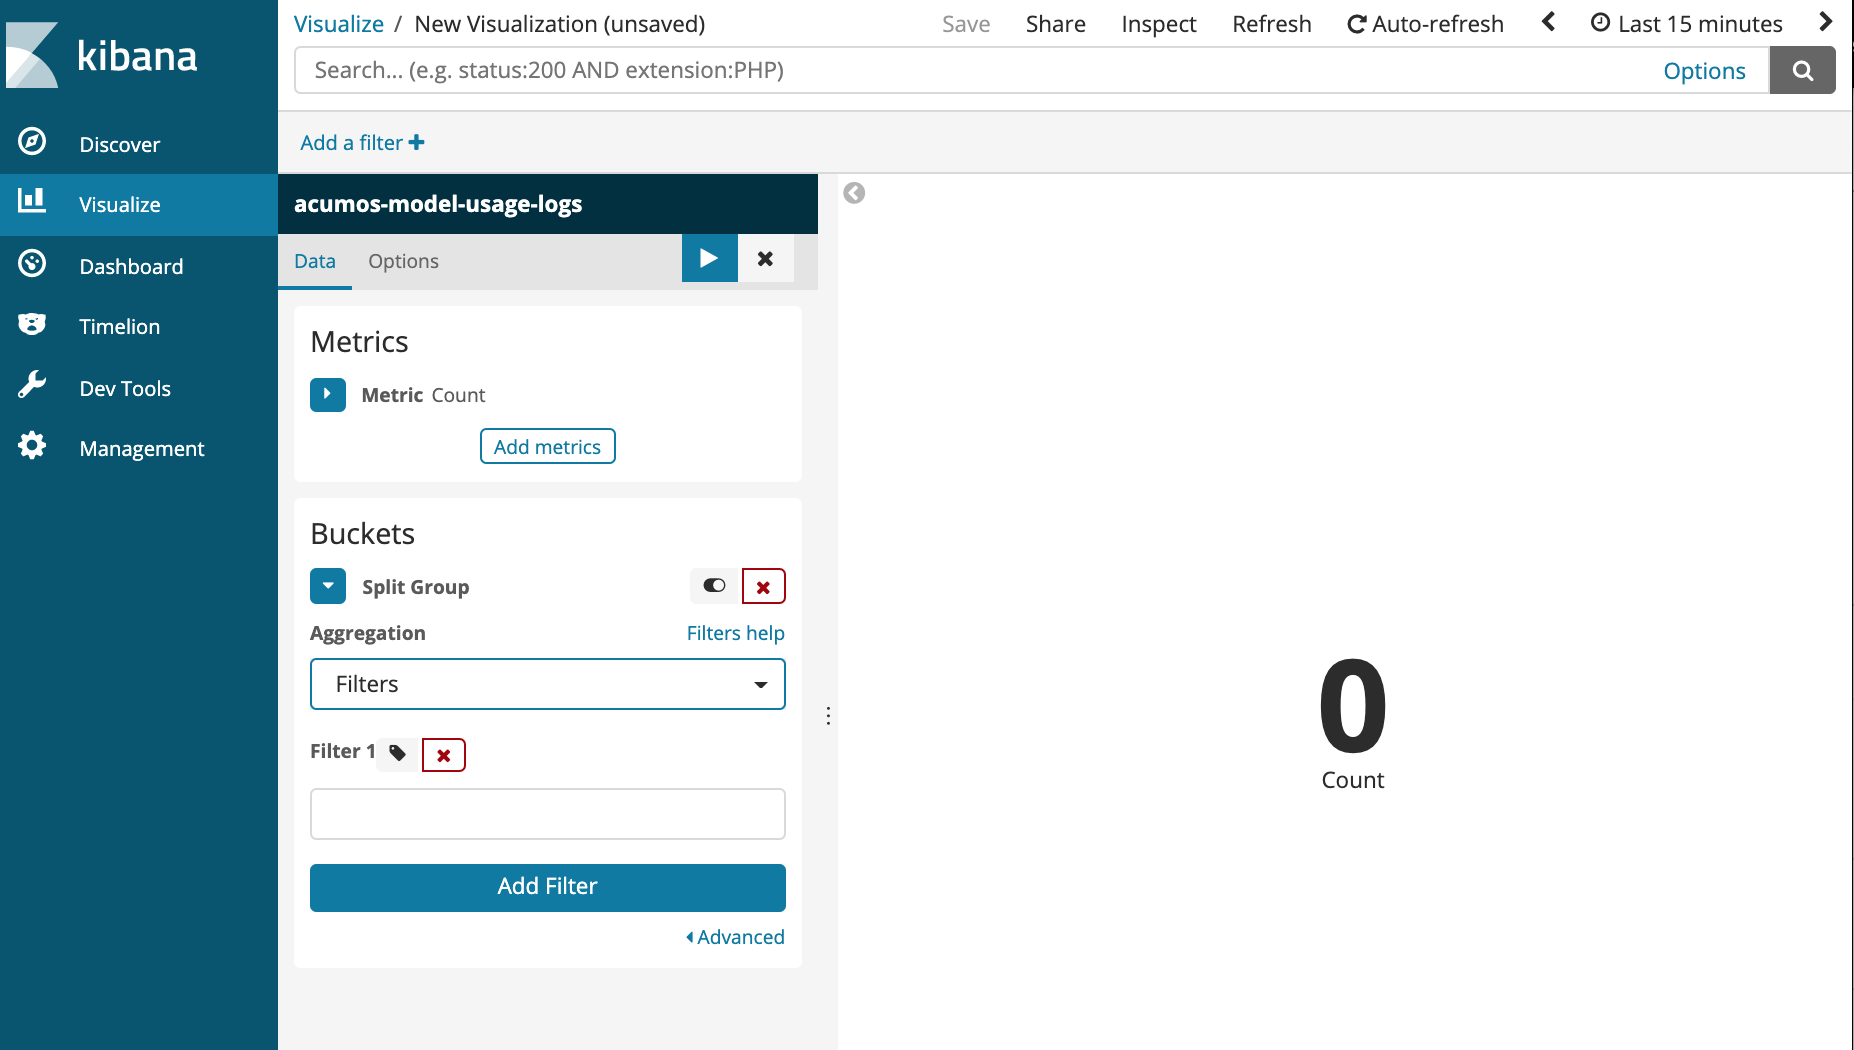
For Filter aggregation, add filter query based on detect model metadata, for example,
model.solutionId:<<model_solution_id>>
You can also set the Filter label for visual clues.
NOTE: You can use any other model fields to filter usage data based on specific requirements. For example, you can use model.revisionId to filter usage records for a specific version of model.
Click > button to apply/save changes and see the count change for each model method request.
NOTE: You can turn on “Auto Refresh” to update UI for any model usage data at specific time intervals.
- Repeat Steps 1 to 5 and create Metrics visualization for other source models and composite model i.e. pixelate and detect-pixelate models as per Soup-to-Nuts example.
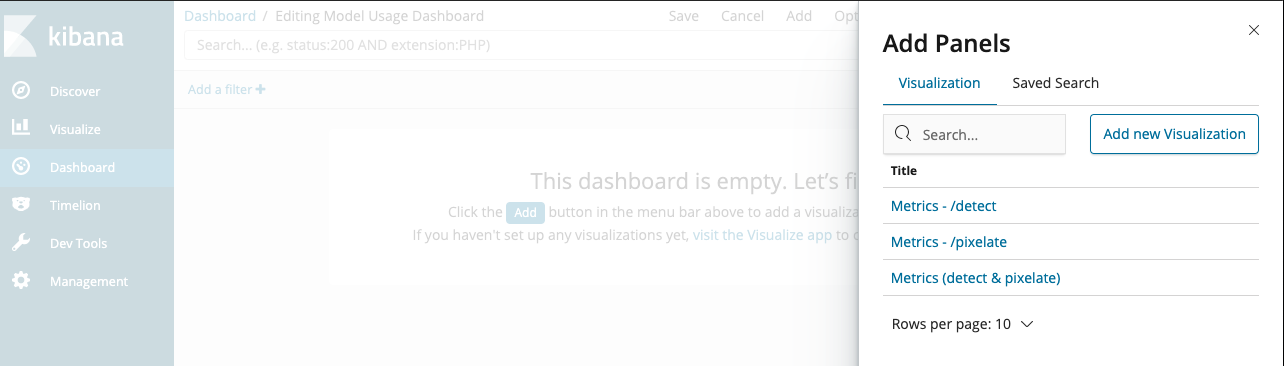
- Kibana allows to setup a Dashboard based on available Visualizations. To setup a new Dashboard, navigate to the Dashboard tab and click “Create new dashboard” button.
In new Dashboard, you can add visualizations that’s been created during previous steps by selecting that visualization.
Once the visualizations added, you can re-arrange them and save the Dashboard.
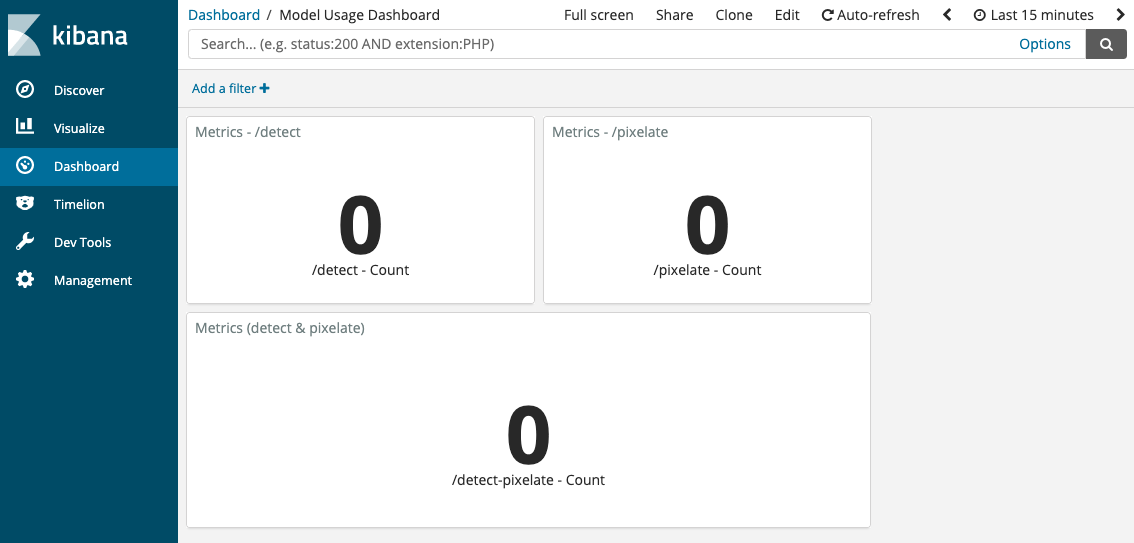
You can set “Auto Refresh” interval to pull model usage data at specific intervals.